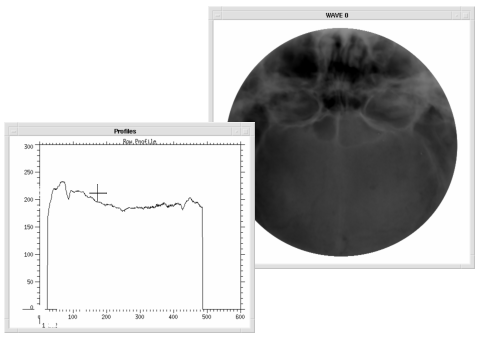
PROFILES Procedure
Standard Library procedure that lets you interactively draw row or column profiles of the image displayed in the current window. The profiles are displayed in a new window, which is deleted when you exit the procedure.
Usage
PROFILES, image
Input Parameters
image — Image array displayed in the current window. May be any data type except string or complex. The profile graphs are made from this array.
Keywords
Order — Controls the direction of image transfer. Set to 1 to write image top-down. Set to 0 to write image bottom-up. The default is the current value of the system variable !Order.
Sx — Starting x value of image within the window. If omitted, 0 is assumed.
Sy — The starting y value of the image within the window. If omitted, 0 is assumed.
Wsize — The size of the new profile window as a fraction or multiple of the default size, which is 640-by-512.
Discussion
To use PROFILES, place the cursor in the original image window. Move the cursor so that the row or column profile is updated interactively. Press the left mouse button to toggle between displaying a row or column profile. Press the right mouse button to exit the procedure.
Example
To create a profile window for the image found in file cereb_demo.img, change to the following directory:
<wavedir>/data
<wavedir>\data
Where <wavedir> is the main PV-WAVE directory.
To display the image shown in Profile Plot in the window, enter:
; Create a 512-by-512 byte array called cereb.
cereb = BYTARR(512, 512)
; Open the file for reading using a logical unit number of 1.
OPENR, 1, !Data_Dir + 'cereb_demo.img'
; Read data from the file into the variable cereb.
READU, 1, cereb
; Display the image.
TVSCL, cereb
; Display the profile window.
PROFILES, cereb
|
|


