HIST_EQUAL Function
Standard Library function that returns a histogram-equalized image or vector.
Usage
Input Parameters
image—The image to be equalized.
Returned Value
result—An array that has been histogram equalized.
Keywords
Binsize—The size of the bin, i.e., the number of elements to consider as having a single value. If not specified, a value of 1 is used.
Maxv—The maximum value to be used. If not specified, the largest value of the elements in image is used. Input elements greater than max are output as 255.
Minv—The minimum value to be used. Should be greater than 0. All input elements in image less than or equal to min will be output as 0. If not specified, 0 is used.
Top—If specified, scales the result from 0 to Top before it is returned.
Discussion
In many images, most pixels reside in a few small subranges of the possible values. By spreading the distribution so that each range of pixel values contains an approximately equal number of members, the information content of the display is maximized.
To equalize the histogram of display values, the count-intensity histogram of the image is required. This is a vector in which the ith element contains the number of pixels with an intensity equal to the minimum pixel value of the image plus i. The vector is of long integer type and has one more element than the difference between the maximum and minimum values in the image. (This assumes a Binsize of 1 and an image that is not of byte type.) The sum of all the elements in the vector is equal to the number of pixels in the image.
HIST_EQUAL uses the HISTOGRAM function to obtain the density distribution of the image. This distribution is integrated to obtain the cumulative density probability function. Finally, the distribution is normalized so that its maximum element has a value of 255.
If image is of floating-point data type, its range of values should be at least 255, unless the Binsize keyword is used. If image is of byte data type, any Binsize keyword is ignored.
Sample Usage
Histogram equalization is commonly used in medical photography and X-rays. It causes the image gray levels that have the most pixels to be allocated the most display levels, thereby maximizing the transfer of information from an image.
Unfortunately, it is this very effect that can sometimes cause unsatisfactory results—histogram equalization chooses a display map-ping based on the area covered by the various features in the image, rather than their importance. This can cause the contrast enhancement of reconstruction artifacts in the large background area, while small features of medical interest are sacrificed.
Example
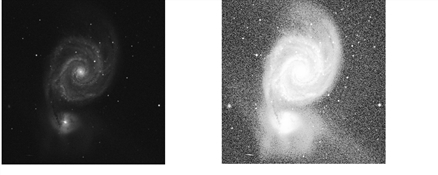
This example uses the HIST_EQUAL function to manipulate the whirlpool image found in:
(UNIX) <wavedir>/data
(WIN) <wavedir>\data
Where <wavedir> is the main PV‑WAVE directory.
The commands shown in this example produce the image on the right in Enhancing an Image with HIST_EQUAL. The HIST_EQUAL function has been used to make the visual elements of the 512-by-512 galaxy image more pronounced.
|
|
; Create a 512-by-512 byte array, get next free logical
; unit number (LUN), open the file, read the image into
; the array, and free the LUN.
whirlpool = BYTARR(512,512)
GET_LUN, unit
filename = !Data_dir + 'whirlpool.img'
OPENR, unit, filename
READU, unit, whirlpool
CLOSE, unit
FREE_LUN, unit
; Transfer the image from top to bottom.
!Order = 1
; Open the window and display the image.
WINDOW, 2, XSize=500, YSize=500
TVSCL, whirlpool
; Open another window and display the histogram-equalized image.
WINDOW, 0, XSize=500, YSize=500
image = HIST_EQUAL(whirlpool)
TVSCL, image
See Also
For more information, see PV‑WAVE User Guide.


