vtkAXES Procedure
Creates a set of axes.
Usage
vtkAXES
Input Parameters
None.
Keywords
Charsize—A floating point scalar or three-element array, the size of the text for tickmark labels and axes labels. (Default: 0.4*Lengths)
Format—A FORTRAN style format string to use for the tick mark labels. (Default: '(g10.2)')
Name—Specify a name to be used to create this object. If an undefined variable is used or no name specified, then a random name is used. This name can be used in calls to vtkCOMMAND to modify this object.
Presentation—Name of a color to use for all annotation. See the file <RW_DIR>/vtk-3_2/lib/vtkcolornames.pro for a complete list of supported color names, where <RW_DIR> is the path to the PV-WAVE installation. If this keyword is present then the default annotation style for interactive viewing is replaced by one for presentation graphics, where all annotation is of uniform size and color, where the text always faces the camera, and where the origin of the z-axis is at the end of the y-axis. This keyword is intended for use only after a view has been established (with vtkSURFACE or vtkPOLYSHADE for example), and because of this, the Az keyword must be input as the same Az value used to established the view. The Presentation keyword causes the following vtkAXES keywords to be ignored:
Position—An array of three floating point numbers in data coordinates describing the origin for the axis. (Default: [0, 0, 0])
Lengths—Array of three floating point numbers describing the length of the x, y, and z axes, respectively, specified in data coordinates. (Default: [1, 1, 1])
Labels—If non-zero, tick marks drawn are labeled with default values.
LOD—If nonzero, the tickmarks are created as level-of-detail actors to aid in keeping a high frame-rate during frequent render requests due to user mouse interaction. If set to a value greater than 1, the number of points to use in the random cloud.
Sigfig—An integer, the number of significant figures to use for the tick mark labels. (Default: 2).
TextColor—The color to use for text used for [XYZ]Title. See the vtkWINDOW Procedure for possible ways to specify the color. (Default: 'white')
Tickscale—A float, a scaling value passed to vtkSCATTER for the tick mark glyphs. (Default: 0.33)
Ticksymbol—An integer, passed to vtkSCATTER to set the glyph to use for the tick marks. (Default: 0, a sphere)
Yorientation—If nonzero the Y title and tick labels are rotated 180 degrees, which is the preferred orientation for situations where the Z axis is typically vertical, such as in vtkSURFACE.
Other keywords are listed below. For a description of each keyword, see Chapter 21: Graphics and Plotting Keywords.
Discussion
This procedure creates three axes displayed as lines in the x, y, and z direction, with an optional label at the top of each axis.
Example 1
vtkAxes, lengths = [1,1.5,2]
Example 2
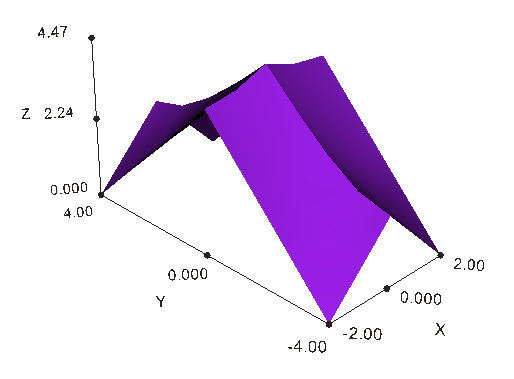
vtkWINDOW, Xsize=800, Ysize=800, Background='white'
z = DIST(5,9)
vtkSURFACE, z, FINDGEN(5)-2, FINDGEN(9)-4, Az=-45, /Noaxes, $
Shades='purple'
vtkAXES, lengths=[4,8,MAX(z)], Position=[-2,-4,0], Az=-45, $
Xtitle='X', Ytitle='Y', Ztitle='Z', $
Xticks=2, Yticks=2, Zticks=2, $
Presentation='black'
 |
See Also


