Traces
A trace is used as a debugging tool. It can also be used for session recording if you want to play back a session for a demonstration for example. A trace can be a recording of all communications to and from the host. You can replay this trace and view exactly what the originator saw on the session, as well as analysing all the information sent from the host. This type of file has a .LOG ending and is not human readable. They can only be played back using the Test file connection in HostAccess.
A test can also be written to check the behavior of commands etc. This type of file has a .TST ending and is written by entering emulation specific information into an ASCII text editor such as NOTEPAD. A .TST file can also be played back through the Test file playback session connection. This is useful for debugging behavior. Pauses in playback may be added by either entering a carriage return, or a $. If you wish to use a $, it must be expanded to a $24 as $ is a reserved character used to indicate a playback control command is present.
Example:
For VT100, to move the cursor to the 10 col, 10 row, then to the 20,20 position, pausing between, you would write:
$1B[10;10H$ $1B[20;20H where $1b is interpreted as the ESCAPE character, the $ is a pause command.
Making a trace
-
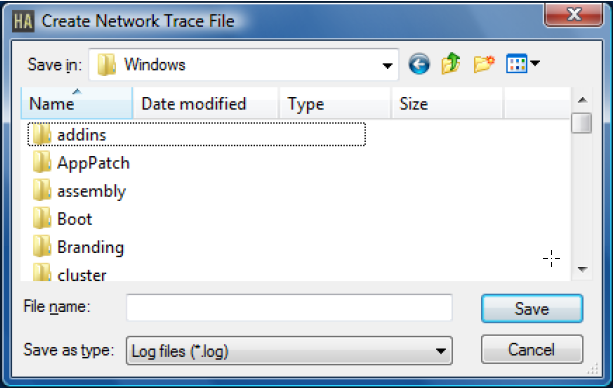
Turn on trace mode: (CTRL, ALT, Z).
-
Enter a log filename. A T will appear on the Status Bar.
-
Log onto your host system and perform some tasks. Turn off the trace (CTRL, ALT,Z).
Replaying a trace
-
Create a new session in HostAccess. Select Test file as your connection, select the emulation that you created the Test file in, then configure the properties so that the logfile is played back.
-
Replay the trace using the spacebar or replay icons.
Test file options
Read buffer size: The amount of data read from the test file each time it is accessed. This should not normally be changed. However, using a smaller size will slow down playback due to increased number of reads required in order to access the test file.