Working with dashboard pages
Hansoft dashboards provide real-time data to help you and your team make just-in-time decisions. They help you view relevant Hansoft data and visualize it in a way that makes it actionable and accessible to your team.
Dashboards are available in the Dashboards area of Hansoft. To access dashboards, click Dashboards at the top of the window.
Dashboards consist of pages and charts/item views.
- Pages contain charts and item views. A page can contain different types of charts and usually serve a specific purpose. For example, you may have a Quality Assurance dashboard page that testers can view to understand the status of a release.
- Charts visually represent Hansoft data in graphical format. Several types of charts are available. Item views display a list of items in a table format. You can click an item to open it. See Working with dashboard charts and item views.
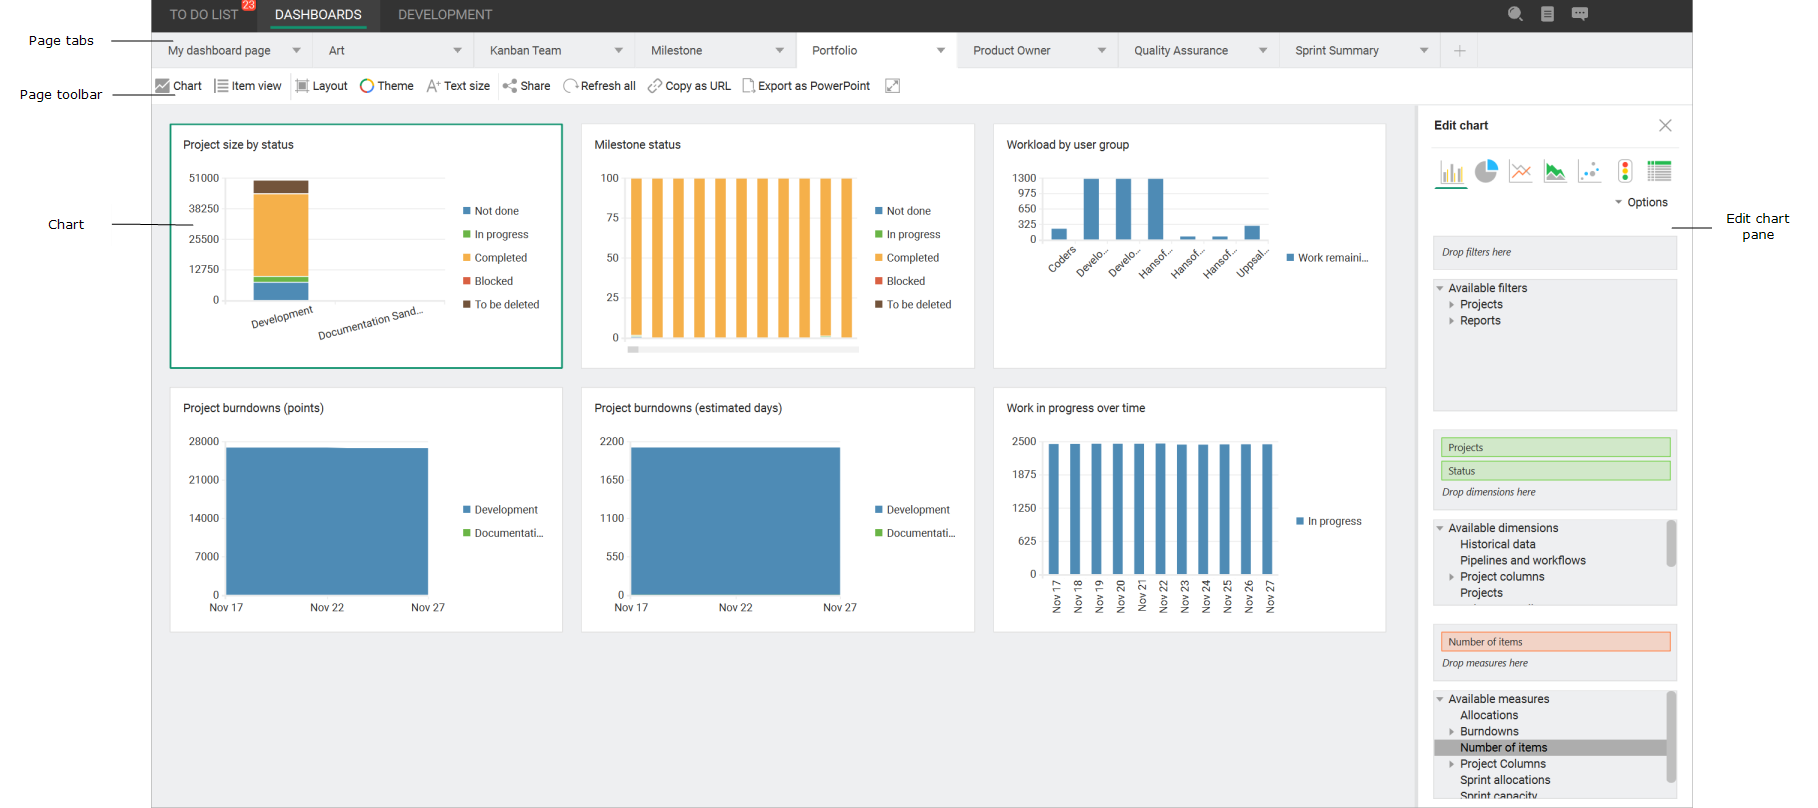
Dashboards contain the following areas.
| Area | Use to: | More information |
|---|---|---|
| Page tabs | View a dashboard and perform actions on it. | Using page tabs |
| Page toolbar | Perform actions on dashboard page. | Using the toolbar |
| Edit chart pane | Configure the settings for a chart or item view. | Adding charts to dashboard pages and Editing dashboard charts and item views |
| Chart | View Hansoft information in a chart format. | Dashboard chart types |
| Item view | View a list of Hansoft items in a table format. Click an item to open it. | Adding item views to dashboard pages |
The page tabs let you navigate between different dashboard pages you have access to. You can also perform the following actions from the tab area.

- To add a new page, click + to the right of the dashboard page tabs and select New page. See Adding dashboard pages.
- To add a new page from a page template previously saved from Hansoft, click + and select New page from template. See Adding dashboard pages from templates.
- To hide a page you no longer want to view, click
 on the tab and select Hide. See Hiding dashboard pages.
 - To reopen a hidden page, click , select Open existing page, and select the page to open. See Opening hidden dashboard pages.
- To rename a page, click on the tab and select Rename. See Renaming dashboard pages.
- To delete a page, click on the tab and select Delete. See Deleting dashboard pages.
Use the toolbar to perform the following actions on dashboard pages. Some actions may not be available depending on your page permissions.
| Button | Click to: | More information |
|---|---|---|
| Chart | Add a new chart to the bottom of the page. | Adding charts to dashboard pages |
| Item view | Add a new item view to the bottom of the page. | Adding item views to dashboard pages |
| Layout | Select the layout to use for the page. The numbers next to each option show the column width as percentages of the view width. | Changing dashboard page appearance |
| Theme | Select a color theme to use for the page. By default, charts use the color theme for the page they are on, but you can override the theme for a specific chart in the chart options. | |
| Text size | Increase or decrease the text size in charts and item views on the page. | |
| Share | Share the page with users and groups for viewing and editing, or only viewing. This button is only available if you have permission to share the page. | Sharing dashboard pages for viewing and editing |
| Refresh all | Refresh the entire page, including all charts and item views. | -- |
| Copy as URL | Copy a URL to the page to share with other team members or use for other purposes. Requires that the Hansoft web service is configured and the web service base URL is set by the administrator in the Admin area. See Installing and configuring the web service and Editing the web service base URL. | -- |
| Export as PowerPoint | Export the page to a Microsoft PowerPoint presentation. | Exporting dashboard pages to Microsoft PowerPoint |


