How To: Creating a chart for open bugs
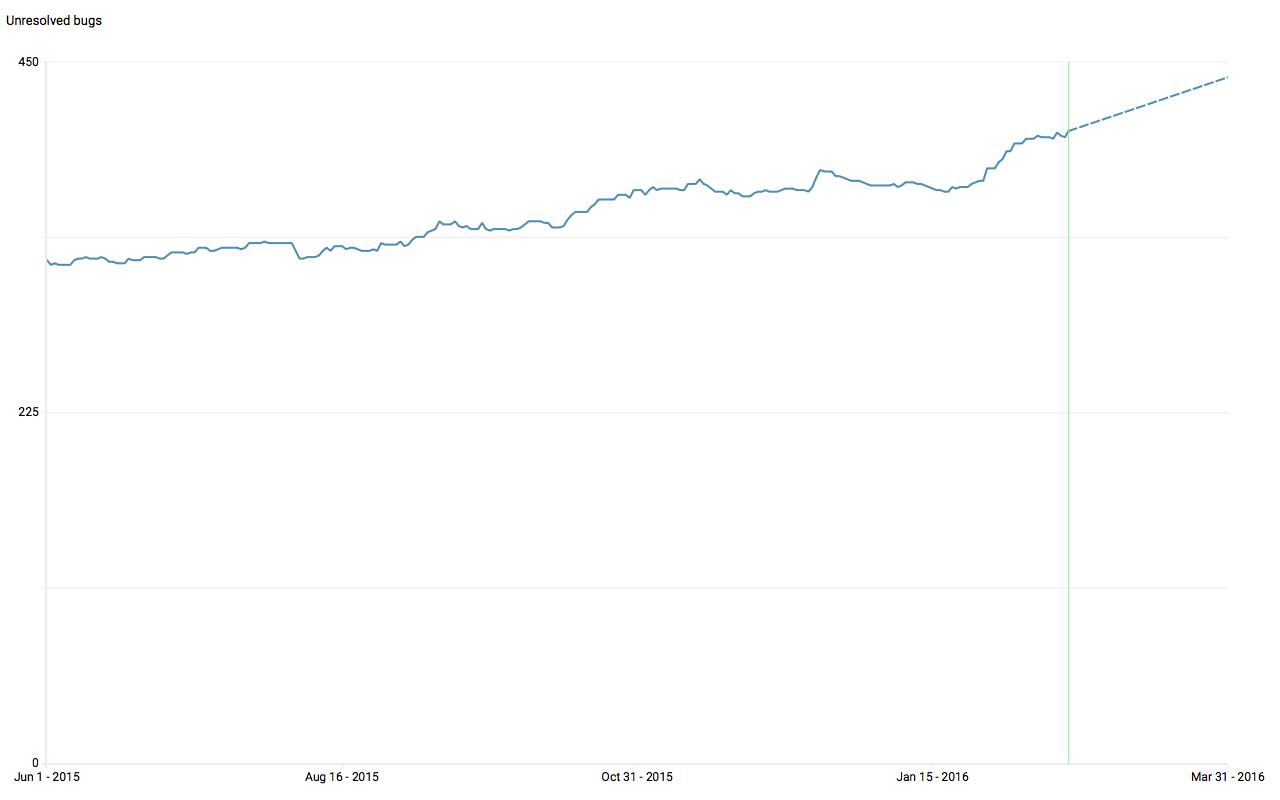
In this topic, we will show you how you can start tracking open bugs over time as in the example graph below:
We assume that:
- You manage all your defects in the Quality Assurance section of Hansoft
- You use a workflow where you can define which states that represents "Open".
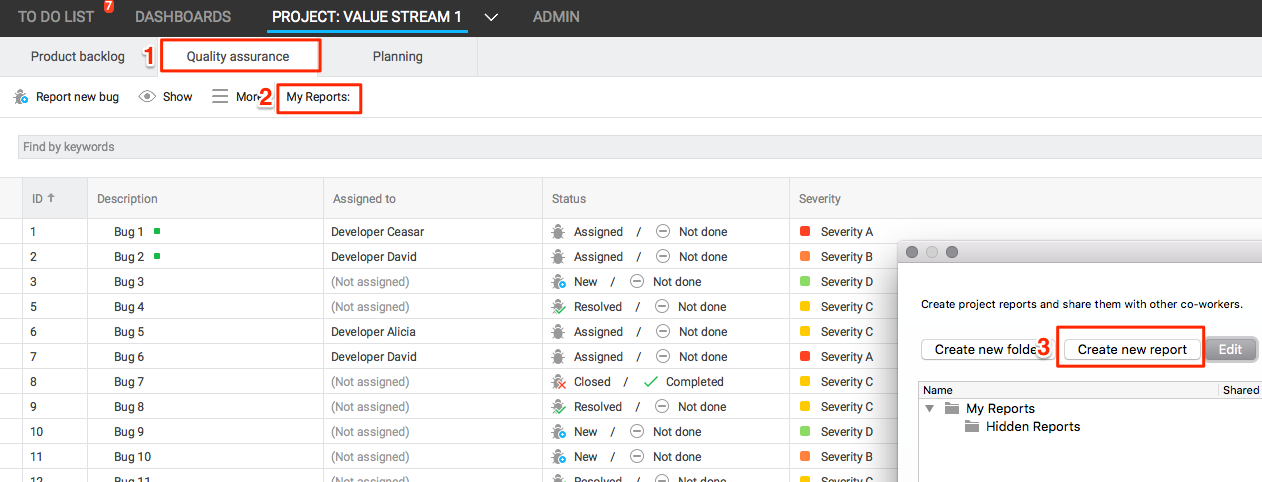
Create the report with Open Bugs
1. Go to the Quality assurance section of your project
2. Click on My Reports
3. Create a new report
4. Name the report "[Project name] - Open Bugs"
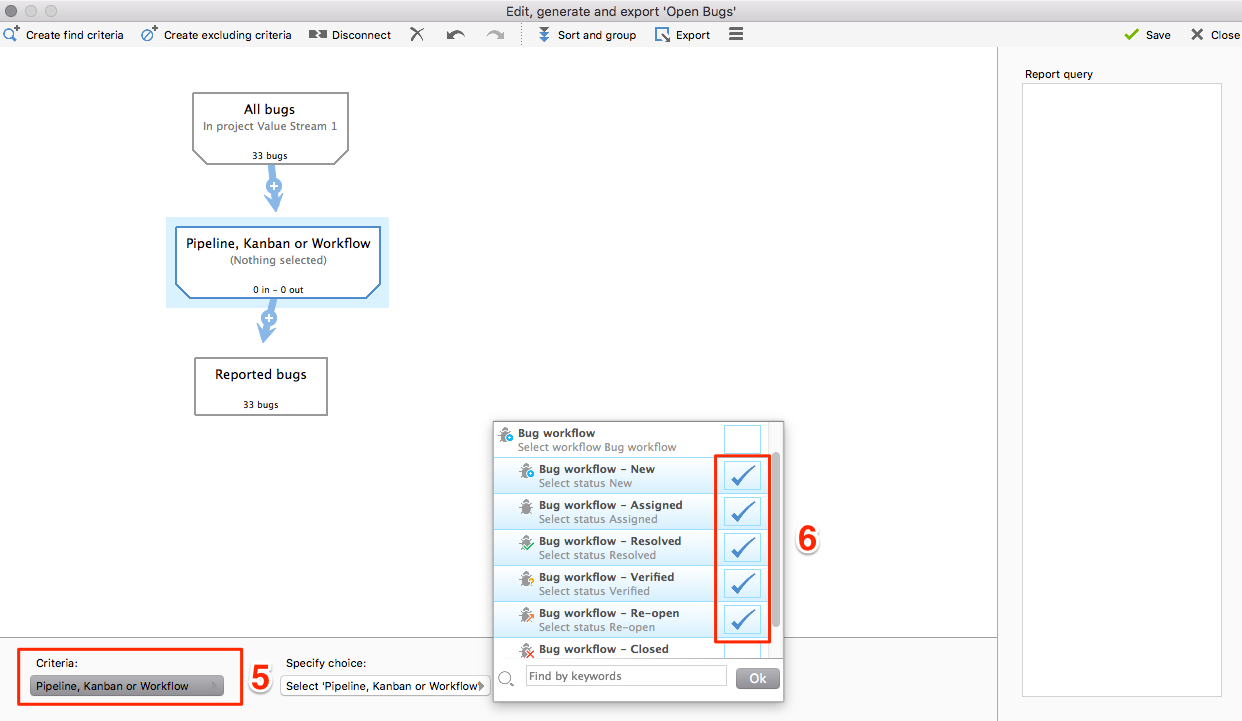
5. Select the middle box in the editor and the criteria Pipeline or Workflow
6. Specify the choices that corresponds to the workflow states that should be included as Open Bugs
Note: If you want to understand open bugs across several projects you will have to create this report in the Portfolio Find report library instead of in the Quality Assurance Section.
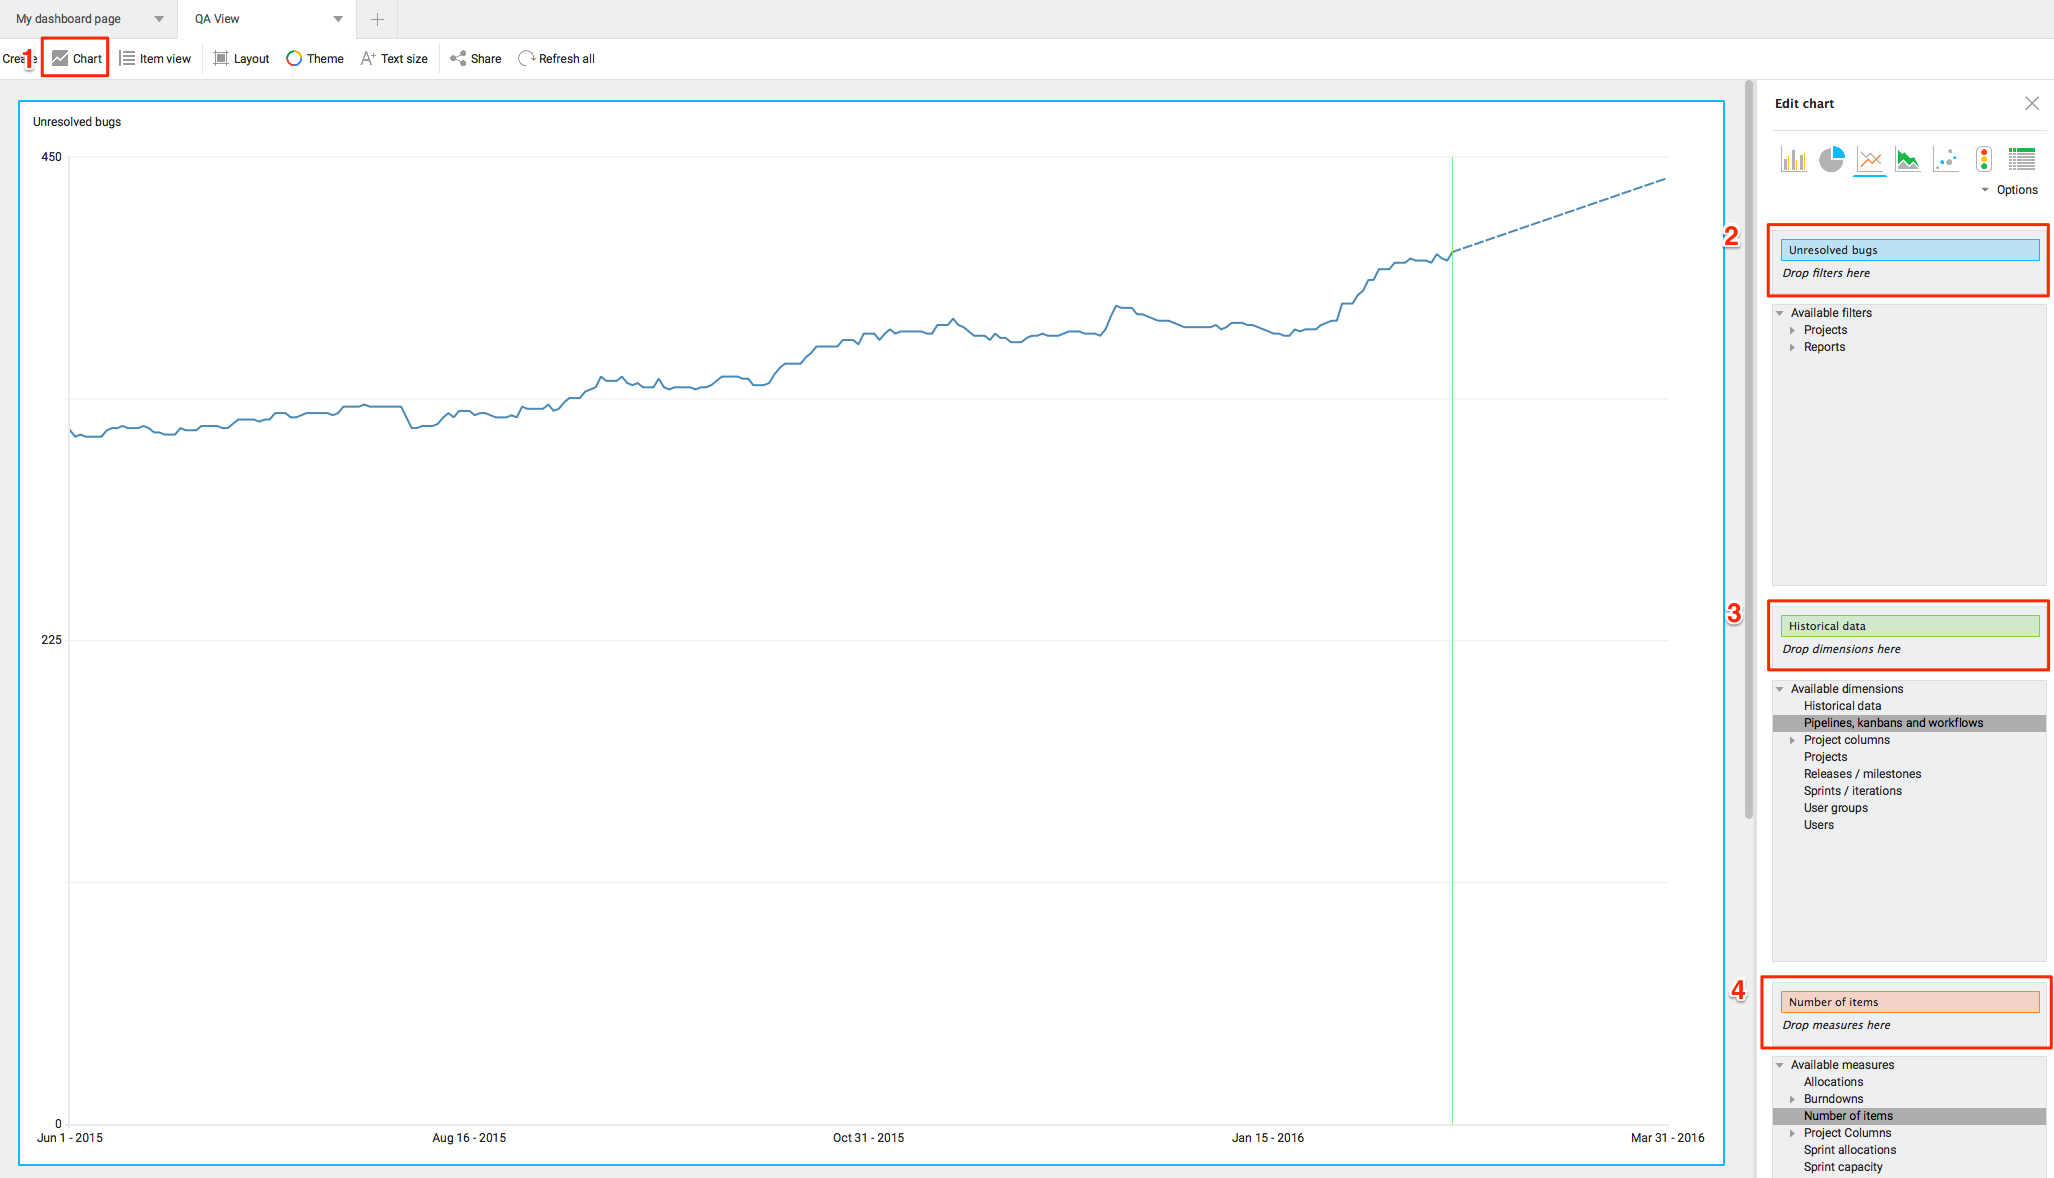
Setup the chart
1. Go to Dashboards and create a Chart on a new page
2. Add your report as a filter (you can find it under Reports)
3. Add Historical data as a dimension. This will start the snapshot of information every night, so you might not see any information into the past to start with.
4. Add Number of Items as the measure to track how many bugs that are open.
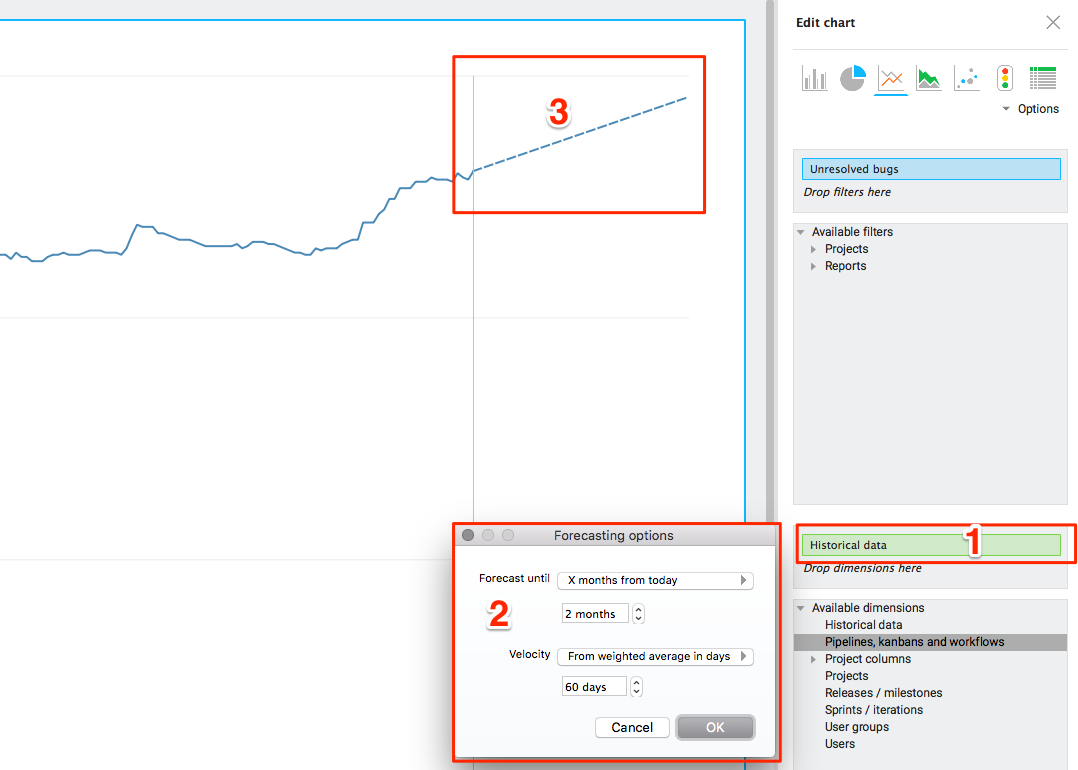
Automatic forecast to see bug trend
1. Click on the green Historical Data bar and select Forecasting Settings
2. Edit the forecasting settings so that you look a a few weeks/months into the future and base it on the historical data.
3. Click OK to see the forecast of how your bugs are trending
Note: If this is the first time you are setting up the chart you probably have to wait a day until the forecast appears.