How To: Creating a chart for arrival and departure of bugs
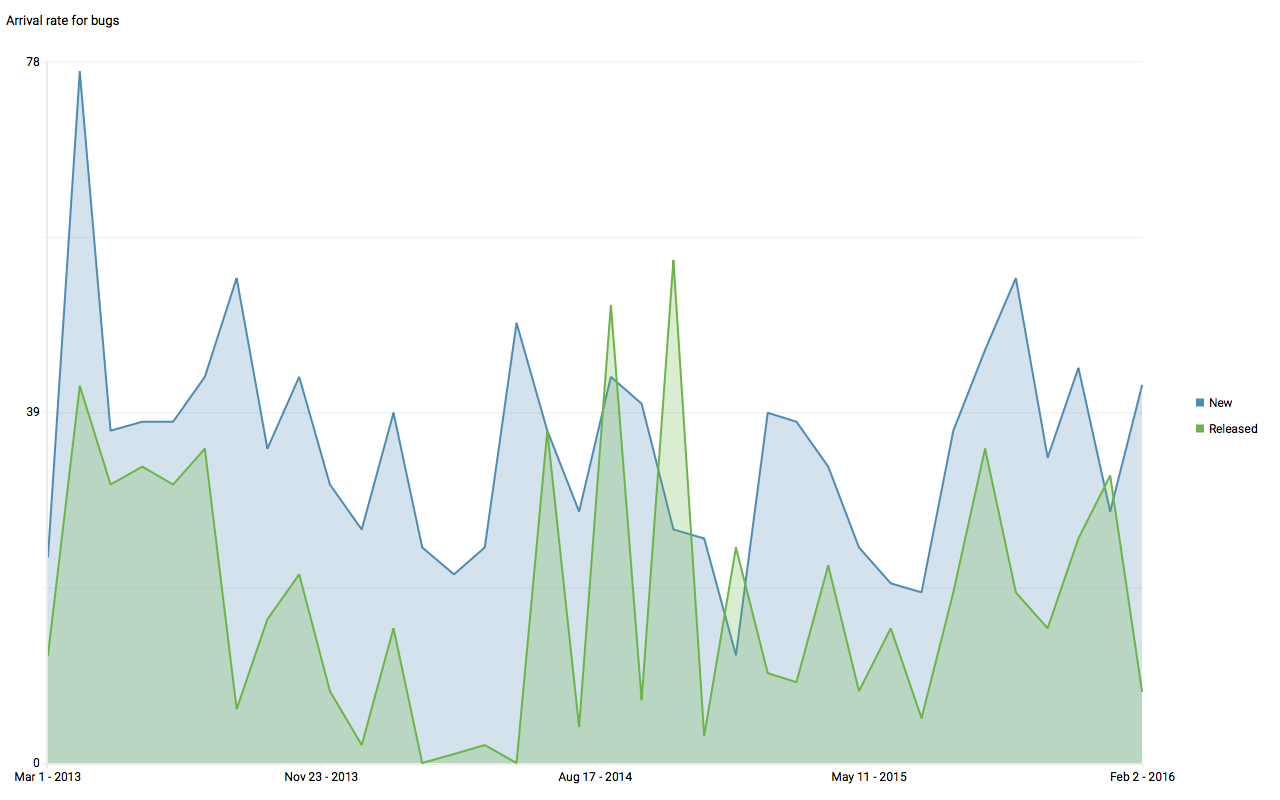
This topic shows you how to see how many new vs. closed bugs that is in the Quality Assurance section of Hansoft.
Create the chart
1. Go to the Dashboards section and add a new Chart object
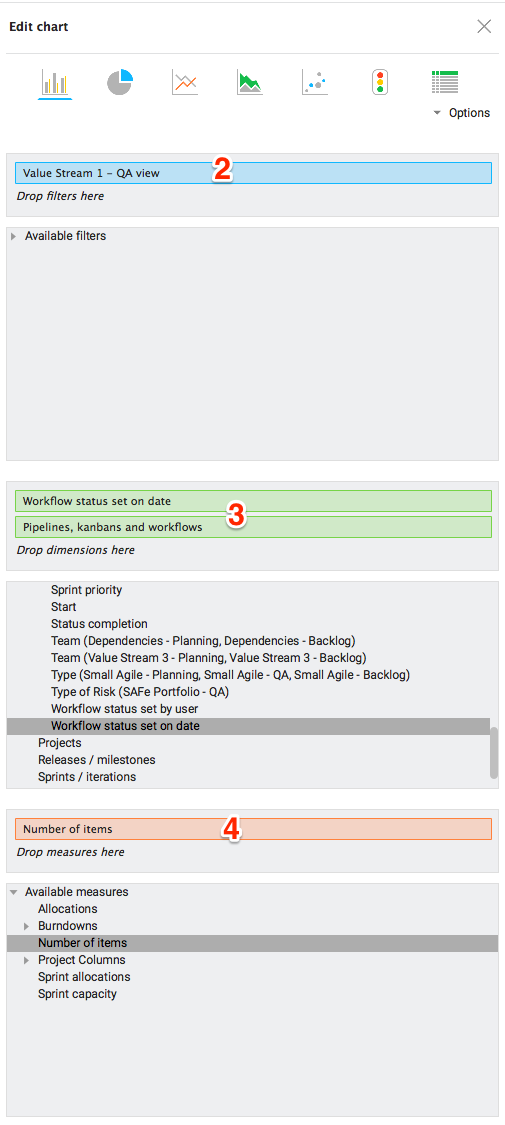
2. Add your project as a filter. Make sure to click on it and select to only see items in the QA view (where the bugs are)
3. Add the dimensions Workflow status set on date and Pipelines and Workflows.
4. Add the Number of items as your measure.
Configure the chart
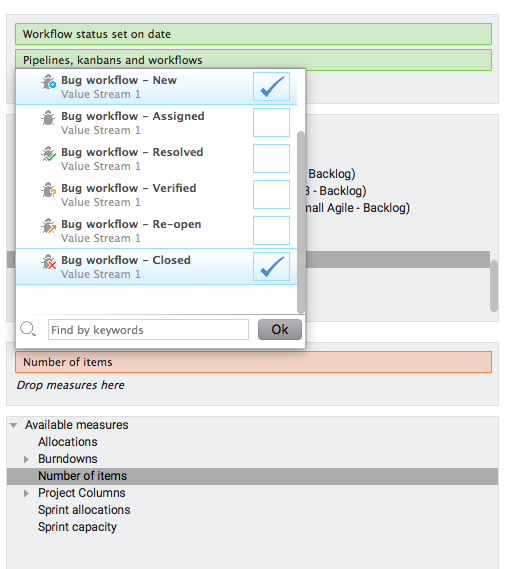
1. Click Pipelines and workflows and select Filter. Select the check boxes next to the two states in your workflows that represent the New vs. Closed states.
2. Click the dimension again and clear Suppress Zero Values.
3. Click Workflow Status Set on Date and change the granularity to Days, Weeks, Months, Quarters or Years as you prefer.