QA·GUI
The Helix QAC software comes with a number of sample projects. If you start by analyzing these sample projects, it will help you to gain an intuitive introduction to the Helix QAC software.
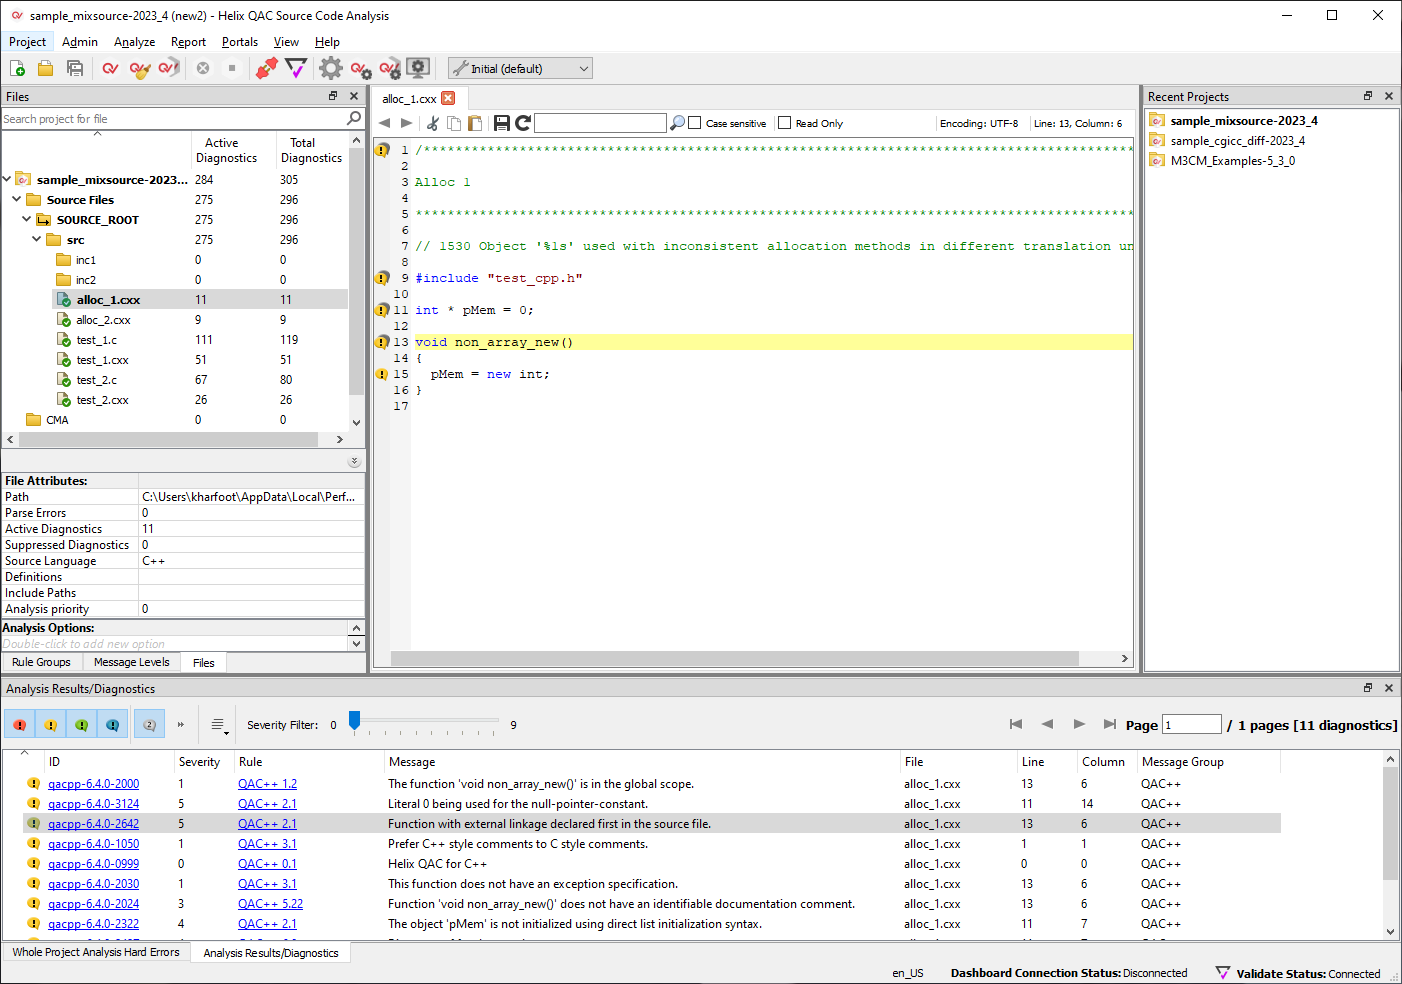
When you start the Helix QAC program, the screen shown below is displayed (there will be minor cosmetic differences between the Windows and Linux versions, but the layout and functionality are the same).
The provided sample Helix QAC projects are listed in the upper right hand panel; if compliance modules, for example, a MISRA compliance module, have been installed, their sample projects will also be listed. After the first use of the Helix QAC GUI, this list will not be updated with the sample projects, but will instead fill from the top with your recent projects.
You can select a project by either double-clicking on it in the Recent Projects panel, or by right-clicking and selecting Reopen This Project from the resultant context menu. The left hand Files panel will then be populated.
You can use the Files panel to browse the project directories and view the files contained within the project.
Your selections in the Files panel determine the results displayed in the Analysis Results/Diagnostics panel at the bottom of the window. A file is selected by left-clicking the file with the mouse. Multiple files can be selected in the standard way, by holding down the CTRL key on the keyboard whilst left-clicking each file, or by holding the SHIFT key to select a range of files between two points. Likewise, selecting or deselecting a directory will select or deselect all files within that directory and any sub-directories.
When a single file has been selected, it will also be opened in the central Editor with any diagnostics marked on the left as shown on page 1. All files opened in this way appear in the Editor in a series of tabs. Alternatively, you can open files into the Editor direct from the Analysis Results/Diagnostics panel, by double-clicking on either the colored markers on the left that represent the diagnostics in which you are interested, or the associated message text.
The contents of the file can be edited and saved.
The source files can be analyzed either individually or in a group. There are two kinds of analysis available; "File-based" and "CMA".
- "File-based" analysis operates at the translation unit level and checks for issues such as correct language use, dataflow and layout.
- "CMA" analysis operates across translation unit boundaries and checks for issues such as duplicate definitions, incompatible declarations and unused variables.
This example conducts file-based analysis; CMA analysis can be conducted through the menus in a similar fashion to file-based analysis.
To analyze a single file, select it in the Files panel by right-clicking on it, and then select Analyze Selected File(s).
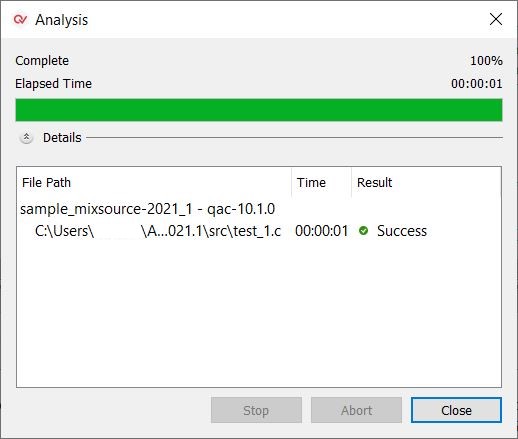
An Analysis dialog opens, informing you of the current state of the analysis, see the image on page 1. On completion of the analysis, click Close.
The Analysis Results/Diagnostics panel at the bottom of the screen is now populated, because the file with results is selected. The code displayed in the central Editor will now have colored diagnostics markers on the left. The analysis results for this file can be explored, and sorted as required by clicking on the column headings in the standard way.
For a particular result, double-clicking on either the colored marker on the left, or the text in the Message column, will open the file in the Editor (if not already open), where the affected line of code will be highlighted. You can then click on the marker to the left of the line of code in the Editor to show the Help links for the associated errors. This is shown on page 1.
If the diagnostic has sub-diagnostics, they can be shown by clicking  or hidden by clicking
  , and expanded or collapsed en masse by clicking
  and
and on the Analysis Results/Diagnostics toolbar.
If you are using a compliance module, the "Rule" column will directly identify which of that compliance module’s rules are being violated.
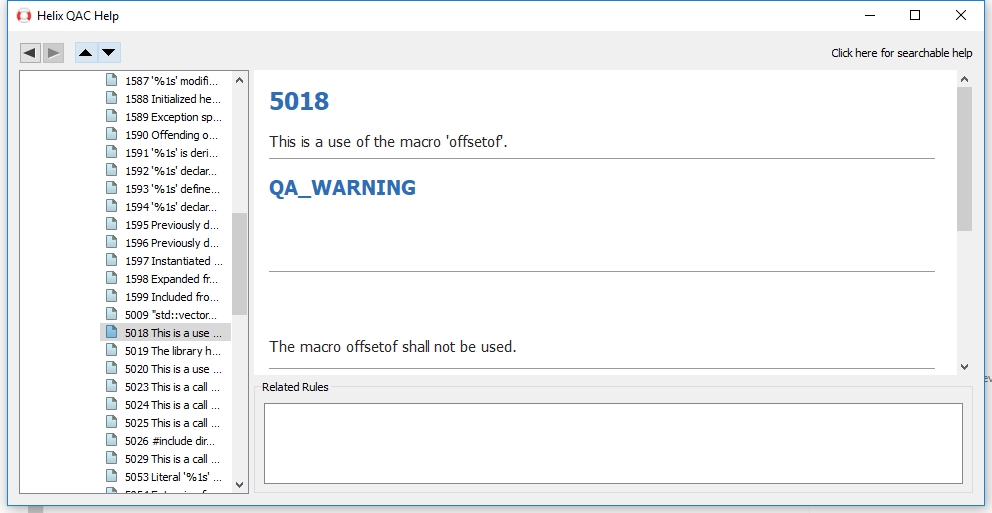
Clicking the highlighted "ID" column will open the Helix QAC help in a separate window, at the relevant information, as shown on page 1.
Clicking other highlighted "ID" or "Rule" links in the results will cause the Help window to update. Alternatively, depressing the SHIFT key while clicking will create a new Help window, allowing you to view multiple Help files at the same time.
The Helix QAC software will display the results of whichever files are currently selected in the Files panel. It is not necessary to open the file to view its results, although having a file open in the Editor while its results are displayed provides colored markers on the left of lines containing diagnostics. Each open file is arranged in the central frame using a standard tabbed view.
Each file can be brought to the fore by clicking its tab.
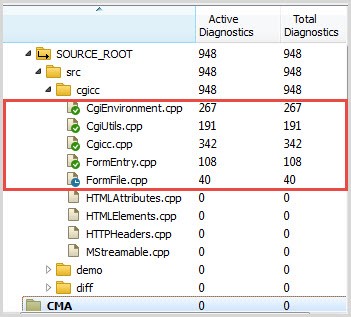
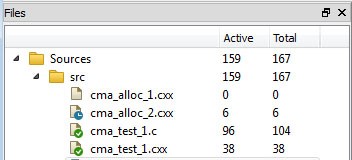
As files are analyzed, the Files panel indicates the current state of analysis for any given file, as shown on page 1.
The "green tick" icon indicates that the analysis completed successfully. If you now modify the file and save it, its analysis results will be marked as "out of date", as shown by the "clock" icon. In the image on page 1 the file cma_alloc_2.cxx has been modified and saved, and is now marked as "out of date":
The left hand panel contains two other tabs, alongside the Files panel: Message Levels, which provides you with a tree view and a count of the analysis results sorted by component within Message Level; and Rule Groups, which provides a breakdown by Rule Group.
The Rule Groups panel is intended to demonstrate which diagnostics violate which rules. Each level of the Rule Groups tree sums all its child levels, but only counts unique diagnostic messages; this means that, if a single message appears more than once within those child levels (to signify the same rule violation in more than one Rule Group), the summation level above those child levels will count the particular message only once. The result of this is that the number of actual rule violations may be greater than the number of diagnostics.
It is possible to apply a message filter within the Message Levels or Rule Groups panel that extends to the results in the Analysis Results/Diagnostics panel. Right-click on an individual message and select Show Only to display only that message, or Hide to remove that message from the display. Likewise, select the same options for a component within Message Levels to hide or display only messages for, as an example, "qac" or "qacpp"; or, for a Rule Group, to hide or display messages for, as an example, "Dataflow Analysis". You could combine these options, for example, to show all instances of a single message relating to "Dataflow Analysis" for "qac".
You can also choose to simply analyze all files in the project at once, by selecting File-based Analysis of project <project name> in the Analyze menu. This will trigger an analysis of every file in the project that is not up to date. The Progress window indicates which files specifically have been analyzed, as shown on page 1.
Analysis results are available in the same ways as previously discussed.
