You can use the QA Wizard Pro dashboard to monitor playback information in a web browser. It can help you see an overview of the most recent sessions run and statistics about your team's automated testing efforts, such as the number of sessions run during a date range and per test computer. For example, if you include batch files in a continuous build process, you can use the dashboard to monitor regression test results and quickly identify failed scripts that may indicate issues in a recent build.
You can view the dashboard in a browser on any computer to monitor local and remote sessions in real-time.
Note: An administrative user is usually responsible for setting up the dashboard.
Tip: You can also use the status tool to review playback information line-by-line, which can help you debug scripts more thoroughly and identify issues in product builds that caused scripts to fail.
To access the dashboard, start a web browser and enter the dashboard URL. Ask your QA Wizard Pro Server administrator for the URL.
The URL includes the name or IP address of the web server that hosts the dashboard and the path to the dashboard application. For example, http://yourserver.com/qawdashboard.
Using dashboard widgets
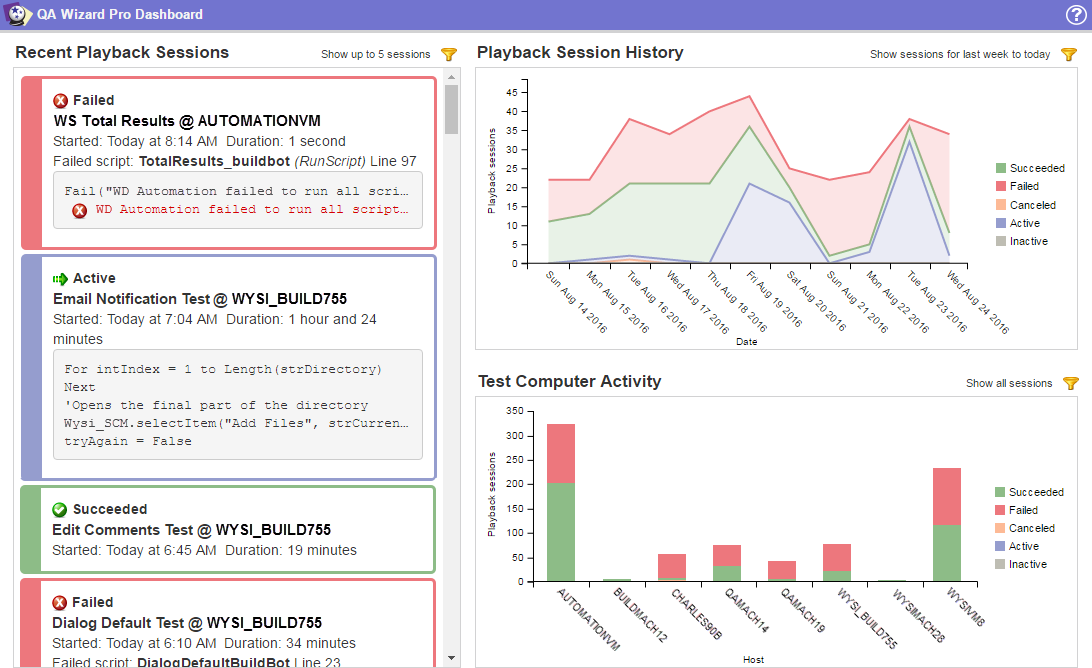
Playback information is displayed in the following widgets on the dashboard.
| Widget | Displays: | To use the widget: |
|---|---|---|
| Recent Playback Sessions | An overview of the most recent playback sessions. Only the five most recent sessions are displayed by default the first time you access the dashboard. |
Click  to change the data displayed in the widget. to change the data displayed in the widget.Mouse over a session and click  to view line-by-line details about it in the status tool if it is installed. to view line-by-line details about it in the status tool if it is installed. |
| Playback Session History | A chart of the number of playback sessions in each run state per day in a date range. Only sessions run during the last week to today are displayed by default the first time you access the dashboard. |
Click to change the data displayed in the widget. Mouse over data in the chart to view more information. Mouse over a run state in the legend to highlight the corresponding data on the chart. Click a run state in the legend to hide the corresponding data from the chart. Click a hidden run state to show the data. |
| Test Computer Activity | A chart of the number of playback sessions in each run state per test computer. All sessions for all test computers are displayed by default the first time you access the dashboard. |
    |

|