Adding matrix reports
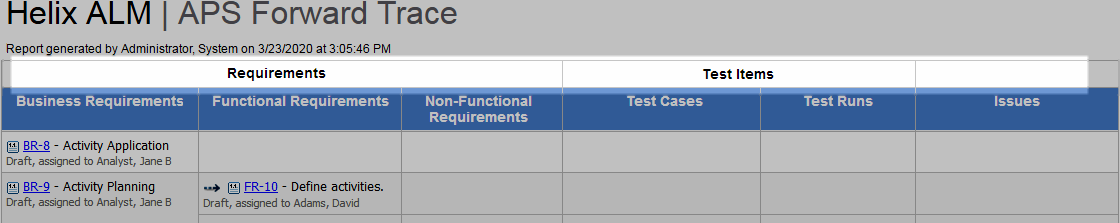
Matrix reports include information to help you analyze linked and related items in a configurable table format. For example, these reports can help you perform:
- Coverage analysis to ensure adequate testing against a project's requirements.
- Impact analysis to see what items may be impacted if you make a change.
- Risk analysis to investigate mitigation efforts and root causes for high-risk issues.
You can define the columns to include in the report, items displayed in columns, how columns are related, details displayed about items, and other report content.
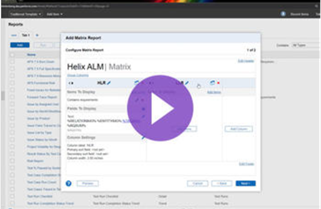
Watch video: Matrix Reporting for Traceability
Adding matrix reports includes the following steps.
On this page:
Create the report
1. Choose Create > Report.
The Select Report Type dialog box opens.
2. Select Matrix and click OK.
The Add Matrix Report dialog box opens.
3. Enter a Name for the report. You can enter up to 128 characters.
This identifies the report in the Reports list
4. To add the report as a favorite, click the star  next to the Name field. The star changes to yellow. To remove the report from your favorites, click the star
  . The star changes to gray. See Adding and removing reports as favorites.
5. Select any Tags to organize the new report with other related reports. See Organizing related reports with tags.
6. Select a Share with option.
- No one prevents all other users and customers from using the report.
- Everyone shares the report with all users and customers.
- All users shares the report with other users.
- All customers shares the report with customers.
- Security groups shares the report with the selected security groups.
Add items to display in columns
You can specify and limit the items displayed in a column by type, item relationships, relationship types, filters, folders, and other criteria. You can display multiple item types and relationships in one column.
1.Click Add Items in the Items To Display area in the column.
The Add Items To Display dialog box opens.
2. Select the item type that the Column contains.
3. Select any Item restrictions to limit the items displayed in the column based on filters, folders, and other criteria.
- Select a Filter to only include items that pass the filter criteria. To learn more about selecting filters, see Selecting filters and options.
- To only include items from a specific Folder, click Browse to select the folder. Select Recursive to include child folders of the selected folder. Click
- If the column contains manual test runs, optionally select a Manual Test Run Set to include only manual test runs in the selected set.
- If the column contains requirements, select a Requirement Document to include only requirements in the selected document. Click Browse to select the document.
- If the column contains automated test runs, click Edit to select the item restrictions you wish to apply. See Filtering automated test results in matrix reports.
4. If the report contains more than one column, select a Related to option to limit the items displayed in the current column to related items in another column.
The list only includes columns to the left of the current column. Select <No Related Column> if the current column is not related to other columns.
5. If the report contains more than one column and a column is selected in the Related to field, select Relationship restrictions to limit the items displayed in the current column based on relationships.
- Select Has any of the following relationships to include items in the selected relationships. Select Does not have any of the following relationships to include items that are not in the selected relationships.
- Select the relationships to include or exclude. Select <All> to include or exclude all relationships or select specific relationships. If you select <All>, links or relationships added in the future are included in reports.
- Select Parents, Children, or Peers to indicate what type of relationship items in the column are in.
- Select Same <items> as <column> column to include the same items from the column selected in the Related to field. Selecting this option makes it easier to format information displayed from the same items and makes important field values more visible.
6. Click OK to save the changes.
A summary is displayed in the column.
7. Repeat the steps to add additional items to display in the column.
Edit fields and text to display in columns
You can specify the field values and text to display for each item type in a column. Each column has default text, but you can change it. You can use text, images, diagrams, tables, and more to format the content. You can also use field codes to include specific field values in a column. Field codes are replaced with information from specific items when the report runs.
1.Click
The Edit <Item Type> Fields To Display dialog box opens. Default text for the item type is displayed.
2. Make any changes to the text and field codes.
For example, the %RQSUM% field code is replaced with the requirement Summary field value when the report runs. Click Insert Field Code to select from a list of available field codes. See Field codes for field code information.
The following additional field codes are only available for matrix reports:
| Field code | Description |
|---|---|
| %ENTITYIMG% | Image that represents the item type. All requirement types use the same requirement image. |
| %ATTACHMENT_FILENAMES% | Filenames for attachments on items. |
| %RELATIONIMG% | Arrow images that represent the relationships of the item: |
 Child in a link Child in a link |
|
 Child in a relationship Child in a relationship |
|
 Parent in a link Parent in a link |
|
 Parent in a relationship Parent in a relationship |
|
 Peer in a link Peer in a link |
|
 Peer in a relationship Peer in a relationship |
|
| %RQ_OUTLINE_NUMBER% | Outline number for a requirement in a requirement document. Only available if the column contains requirements. If a column contains multiple instances of requirements and different selected requirement documents, and the documents contain shared requirements, the outline number from the first document found is used. |
| %RUNRESULTIMG% | Image that represents the manual test run result (passed, failed, or undetermined). |
3. Apply any formatting.
You can use text formatting, images, diagrams, tables, and links. See Working with text fields. If a style is applied to a list field value and the Display field text with formatting option is selected, the field text uses the style formatting in the report.
4. Select Display field text with formatting to display text from item multi-line text fields the same way it is formatted in the item and display values from list fields with the style applied to them.
5. Select Apply style from field and a list field to display the cell in the report with the background and text colors from the style applied to the value set in the field.
6. Click OK to save the changes.
Edit column settings
The column settings specify the column name, sorting, and width.
1.Click
The Edit Column Settings dialog box opens.
2. Enter the Header label. You can enter up to 64 characters or leave the field empty. The field is only available if an extra header row is used to group columns in the report. See Group columns with an extra header row.
3. Enter the Column label. You can enter up to 64 characters.
4. Select a Primary or Secondary sort field and set the sort order for items in the column.
If multiple item types are displayed in the column, only fields that both item types have are available for sorting. If the first Items To Display rule in the first column in the report contains requirements with a specific requirement document selected, the Primary sort field is automatically set to Outline Number (ascending), but you can change it. This sorts the requirements based on the outline order in the selected document. The Outline Number sort option is only available if the column contains requirements with a specific document selected.
5. Select Hide column to hide the column when you preview or run the report.
6. If this option is selected, the Column width and Ignore width if content exceeds it options are not available.
7. Set the Column width in inches, centimeters, or pixels. You can enter up to two decimal places.
Select Ignore width if content exceeds it to display all content in the column even if it exceeds the width setting. If this option is not selected, content that exceeds the column width is not displayed. For example, you may want to select this option if items include large images and you do not want to truncate them.
8. Click OK to save the changes.
The settings are displayed in the column.
Add and rearrange columns
You can add up to 100 columns to a matrix report and arrange them in any order.
- To add a new column, click Add Column. The new column is added as the last column to the right.
- To duplicate an existing column, click
 in the column header. The new column is added to the right of the column you duplicated.
 - To move a column, click
 and
and 
- To delete a column, click
 in the column header. Click Delete to confirm the deletion.
Group columns with an extra header row
You can add an extra header row above columns and merge the header cells to group related columns.
- To add group columns using an extra header row, click Group Columns. You can only add one extra header row.
- To group a header with the column header to the right, click
 . Continue grouping the header until it spans all related columns.
 - To edit the extra header label, click the text in the header cell
- If the extra header only spans one column, the Edit Column Settings dialog box opens. See Edit column settings.
- If the extra header spans multiple columns, the Edit Header Label dialog box opens. Enter the header label text and click OK. You can enter up to 64 characters or leave the field empty.
- To split grouped column headers, click
 . The header is split into individual cells with the same text above the columns.
 - To ungroup columns and delete the extra header row, click Ungroup Columns. Click Delete to confirm ungrouping the columns and deleting the row.
Edit the report header and footer
The report header is displayed at the top of the report and typically includes the report title and other information, such as a logo. The footer is displayed at the bottom of the report. You can use formatted text, images, tables, and links in the header and footer.
1.Click Edit Header or Edit Footer.
The Edit dialog box opens.
2. Make any changes. See Working with text fields.
3. Click OK to save the changes.
Set additional display options
You can set options for how the report is displayed.
- Select Alternate row background colors to use different background colors in alternating rows to make the report easier to read.
- Select Display column headers on each printed page to include column headers on each page of the report.
Preview and save the report
1.To preview the report, click  .
.
To save the report as a PDF, click Save Report As PDF. See Saving reports as PDF files.
2. Click Add.
The report is added. See Running reports for information about running reports.
Troubleshooting
Matrix report configuration errors are displayed in red when adding and editing reports. Mouse over an error to view more information about it. Following are common errors.
| Error | Description | Resolution |
|---|---|---|
| A column can only be related to a column to its left | A column selected in the Related to field in the Items To Display options was moved to the right of the column. Only columns to the left of the column with the affected options can be selected in the Related to field. | Move the column back to the original position or change the value in the Related to field in the Items To Display options. |
| Invalid column: The related column was removed | The column selected in the Related to field in the Items To Display options was removed from the report. | Change the value in the Related to field in the Items To Display options. |
| <No Valid Relation>: At least one parent, child, or peer relation must be selected | None of the relationship options (Parents, Children, or Peers) are selected in the Items To Display options. | Select at least one relationship option (Parents, Children, or Peers) in the Items To Display options or change the Related to field to <No Related Column>. |
| <No Valid Relationship Type>: At least one relationship type must be selected | An item relationship type is not selected in the Items To Display options, but a column is selected in the Related to field. | Select at least one relationship type in the Items To Display options or change the Related to field to <No Related Column>. |