IPLM metrics
Instructions for installing and configuring the Perforce IPLM Metrics package, which can be used to monitor server health. Perforce IPLM Metrics enables display of server status on configurable dashboards.
- Perforce IPLM ships with a comprehensive system monitoring package
- Monitoring for Neo4J, IPLM Server, IPLM Cache
- Comprehensive dashboards
- Based on Prometheus monitoring platform
- Each dashboard is fully customizable
- Ships as installable packages and built into Perforce Virtual Appliance
- Configurable alerts built into Prometheus platform
Starting with PiServer version 2.33.0, PiServer and Neo4j metrics are available to be monitored.
Starting with IPLM Cache version 1.2.0 and IPLM Cache Library version 1.1.0, IPLM Cache metrics are available to be monitored.
Deployment
The following diagram depicts the deployment of the Perforce IPLM Metrics Monitoring solution.
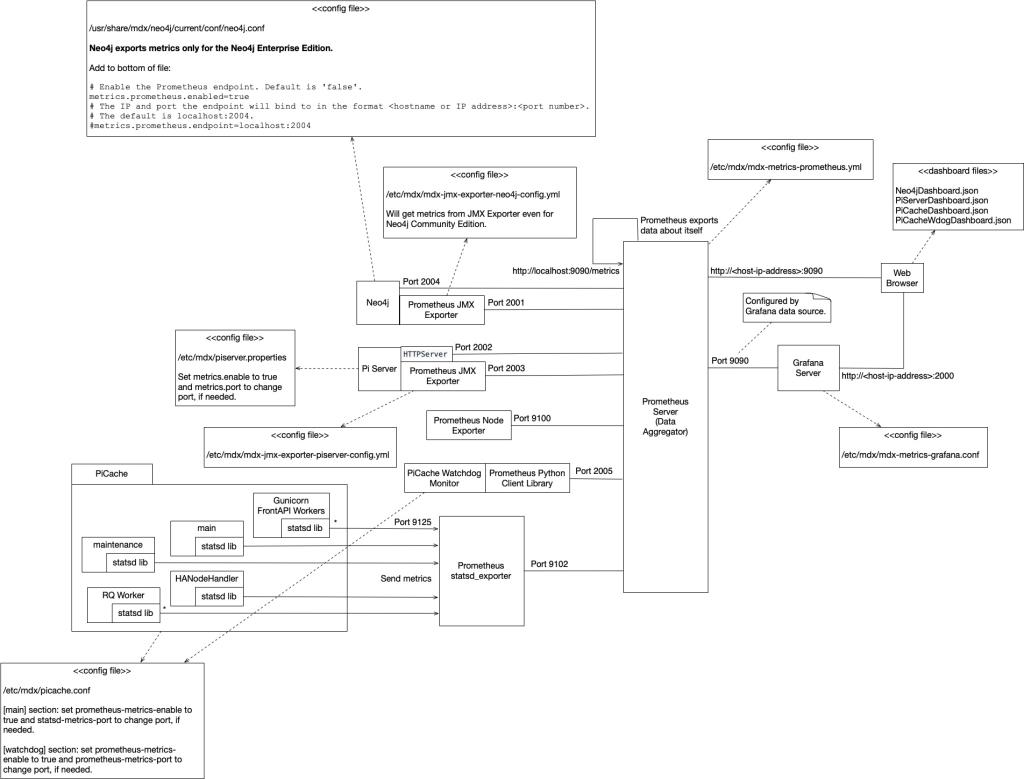
Neo4j JVM (Java Virtual Machine) metrics for the Enterprise Edition are always exported.
Packages
PiServer and Neo4j are part of the mdx-piserver package.
IPLM Cache and the IPLM Cache Watchdog Monitor are part of the mdx-picache package.
The mdx-metrics package contains:
- The Prometheus Server, Grafana Server, JMX Exporter, Node Exporter, and StatsD Exporter
- The Grafana dashboard files (mdx-metrics >= 1.1.1). Previously, these were in the mdx-piextras package.
- A tool, setup_metrics.sh, that can be run to configure Grafana, install the dashboards into Grafana, and update the Perforce IPLM configuration files to enable metrics exporting
The Prometheus Python Client Library and StatsD Library are part of the mdx-picache-lib package.
The mdx-piserver Run package from the self-extracting archive includes the Prometheus Server, Grafana Server, and JMX Exporter.
The mdx-picache Run package from the self-extracting archive includes the Prometheus Server, Grafana Server, Node Exporter, StatsD Exporter, Prometheus Client Library, and StatsD Library.
Metrics setup tool
The mdx-metrics package as of version 1.1.1 contains a helper script at /usr/share/mdx/metrics/scripts/setup_metrics.sh that can be run after installing the mdx-metrics package. This script:
- Sets up the Grafana server with an admin password of admin
- Creates a Prometheus data source within the Grafana server
- Loads the dashboard files in /usr/share/mdx/metrics/dashboards into the Grafana server
- Updates the Neo4j, IPLM Server, and IPLM Cache configuration files, if they exist, to enable them to export metrics
To run the script, you must be root, the Grafana server must already be running and listening on port 2000 (its default port), and the Prometheus server must already be running and listening to port 9090 (its default port).
Metrics available
IPLM metrics details contains information on the Perforce IPLM metrics and the metrics from the third-party components used.
On a machine running Perforce IPLM software, to see the available metrics and a Help description of each:
-
For ports that are bound to only the localhost (i.e., not externally accessible), the curl command, using the port the metrics are exposed on and using the
metricsendpoint, can be used on the same machine as running the service of interest. For example, if the Neo4j Enterprise Edition is running, to see the metrics Neo4j and Perforce implemented for Neo4j and a description for the metrics:$ curl localhost:2004/metrics
The metrics implemented by Perforce are prefixed with
mdx_neo4j_, and the metrics implemented by Neo4j are prefixed withneo4j_. - For ports that are externally accessible, a web browser on another machine can be opened and connected to the IP address and port of the metrics of interest with the
metricsendpoint. For example, given a machine with IP address 10.211.55.8, to see the same metrics as above, navigate to the URL:http://10.211.55.8:2004/metrics.
The Prometheus server can also be accessed externally over a web browser with the URL http://<IP-address>:9090, bringing up Prometheus's built-in expression browser. To see which of the components are exposing their metrics, in the Console tab enter the command up and click on the Execute button. To see all the Neo4j metrics, enter the command {job="neo4j"} and click on the Execute button.
Prometheus requires the time on the machine it's running on to be set correctly. When using Prometheus, if you find that it is not showing any data, please check the time on the machine and correct it if needed. This can happen, for example, on a Virtual Machine that's been suspended for a while.
Grafana dashboards
Perforce supplies a Grafana dashboard for PiServer (PiServerDashboard.json), Neo4j (Neo4jDashboard.json), IPLM Cache (PiCacheDashboard.json), and the IPLM Cache Watchdog Monitor (PiCacheWdogDashboard.json). These can be used as-is or as a starting point for your own dashboards. You can find the files in the following path:
/usr/share/mdx/metrics/dashboards
To access the Grafana server, open a web browser and navigate to the URL http://<IP-address>:2000.
If you have not run the /usr/share/mdx/metrics/scripts/setup_metrics.sh script (see above) and this is the first time the Grafana server is being accessed, the default login credentials for Grafana are username admin and password admin. Grafana will prompt you to change the password the first time you logon.
If you need to import (load) a dashboard into Grafana, in the Grafana webpage:
- Hover the cursor over the
Dashboardsicon on the left-side of the page - Select the
Managelink - Select the
Importbutton - Select the
Upload .json Filebutton - In the resulting File Explorer window, navigate to the where the dashboard JSON files are located and select the dashboard to upload
If Grafana has not already been set up with a Data Source pointing to Prometheus on the machine, in the Grafana UI:
- Hover the cursor above the Configuration gear icon on the left
- Select the
Data Sourcesitem - Click on the
Add data sourcebutton - Select the
Prometheusbutton - In the resulting
Settingspage, in the HTTP section set the URL to the URL Prometheus exposes the metrics on,http://<IP-address>:9090 - Click on the
Save & Testbutton to verify the data source is working - Navigate back to a dashboard. The dashboards should be fully functional now.
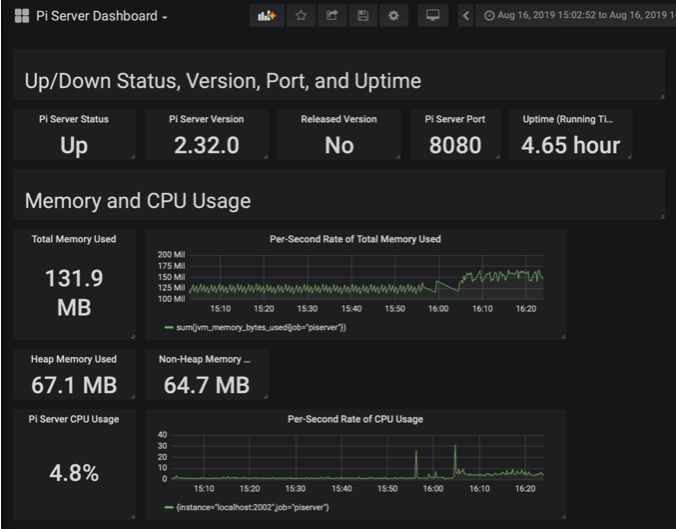
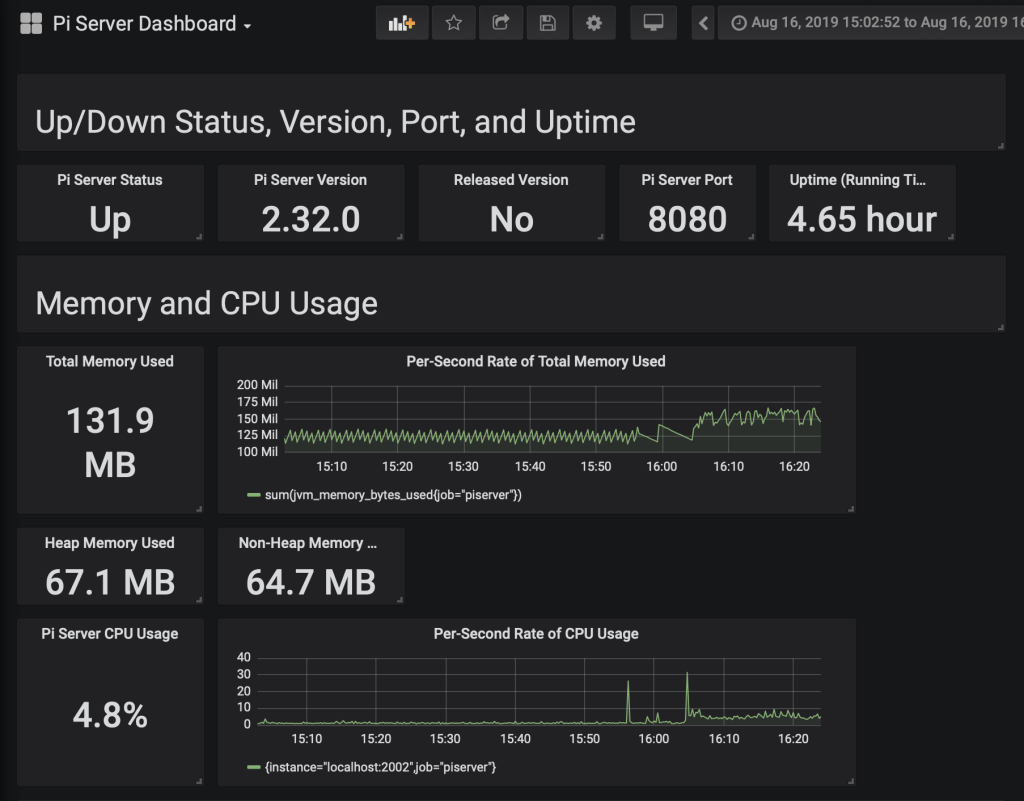
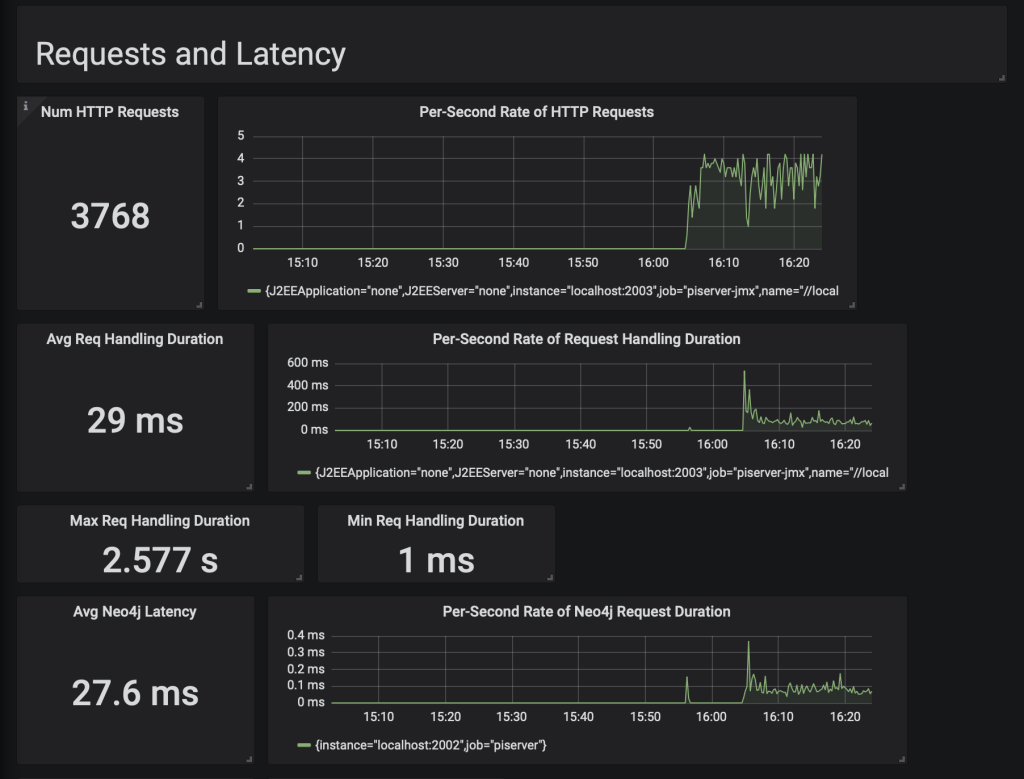
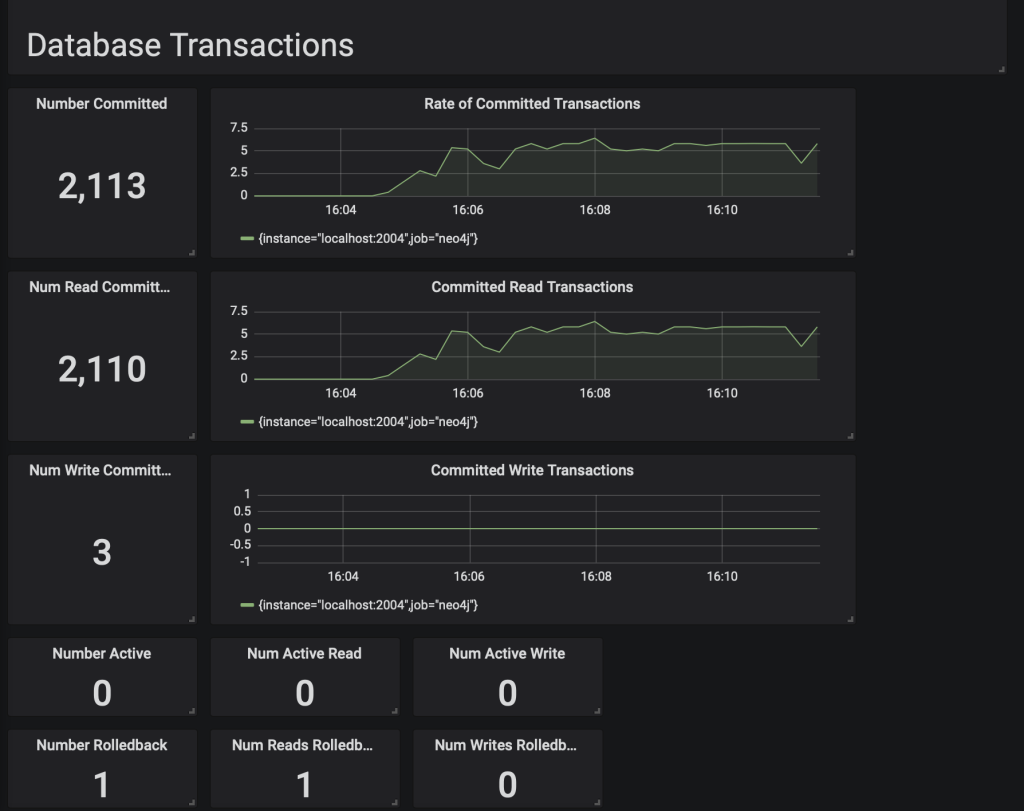
PiServer Dashboard
Some screenshots demonstrating the PiServer dashboard:
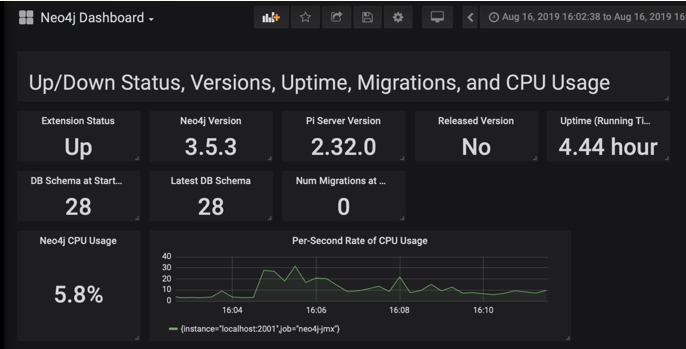
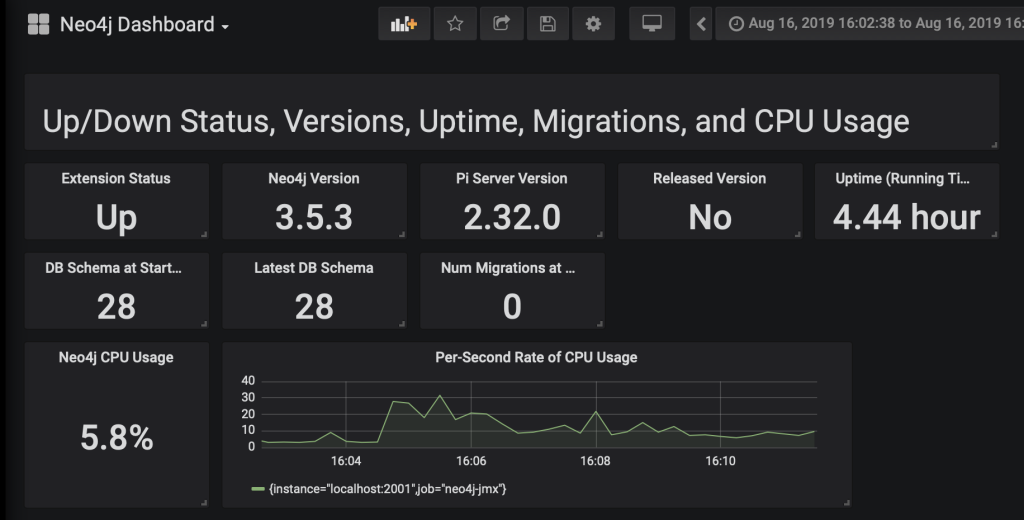
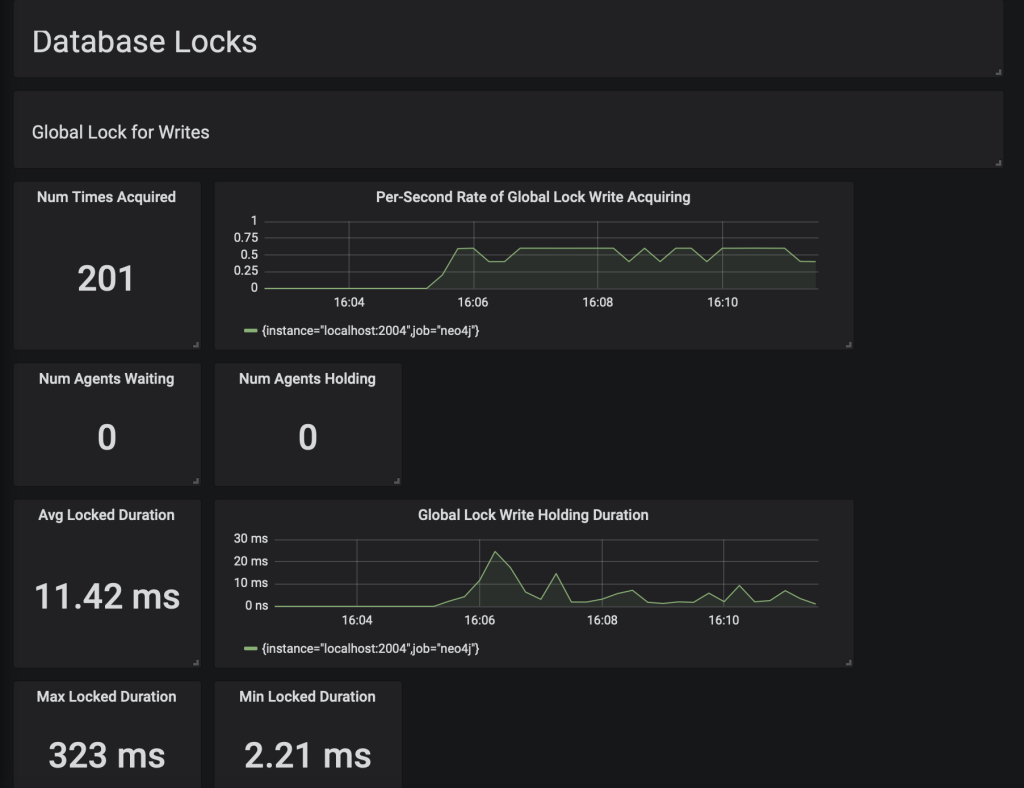
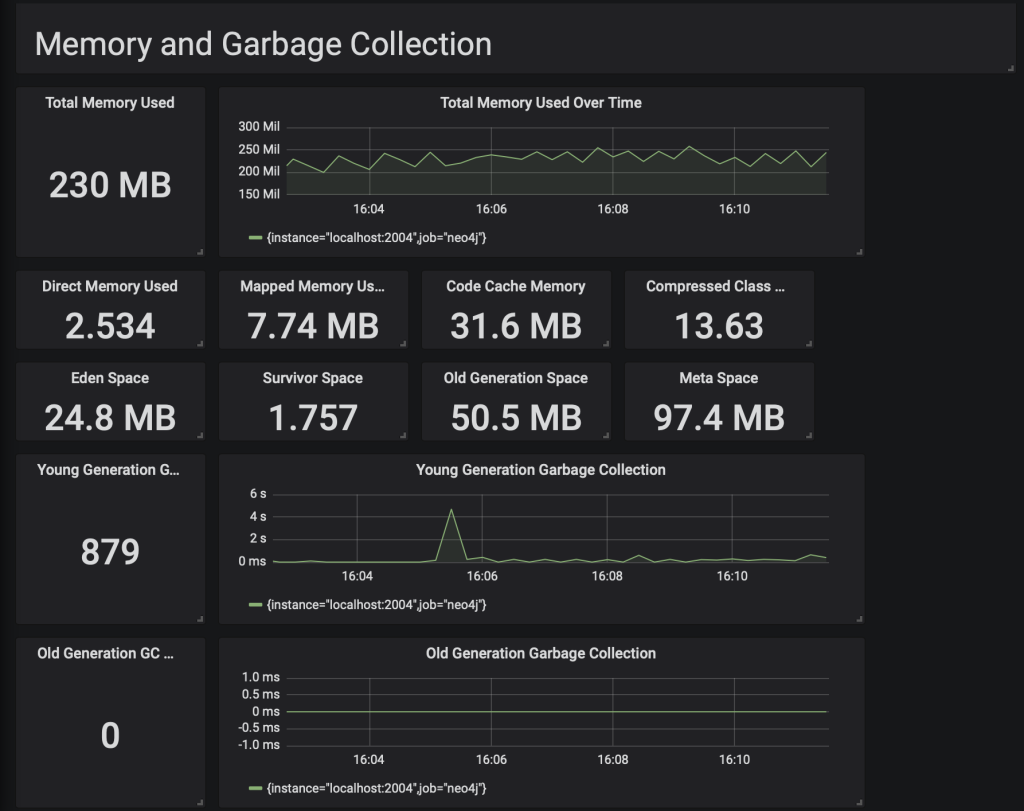
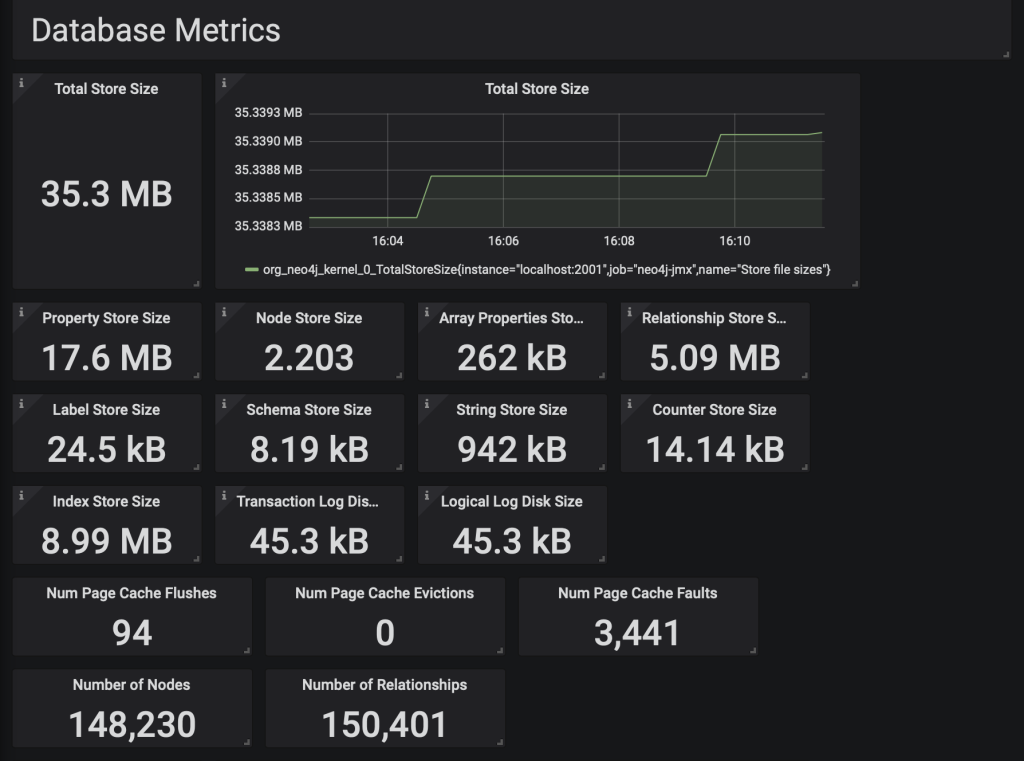
Neo4j dashboard
Some screenshots demonstrating the Neo4j dashboard:
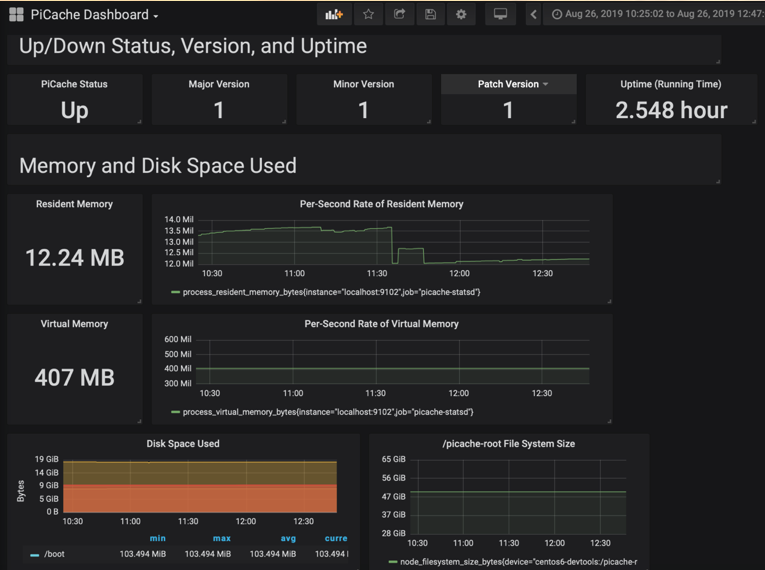
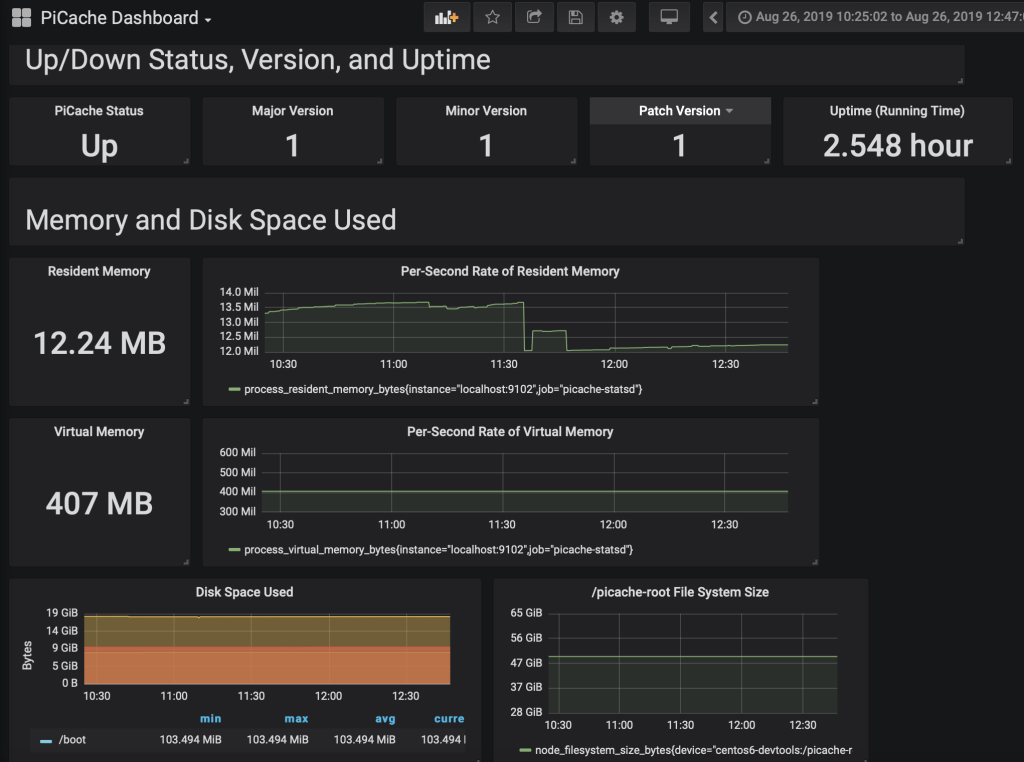
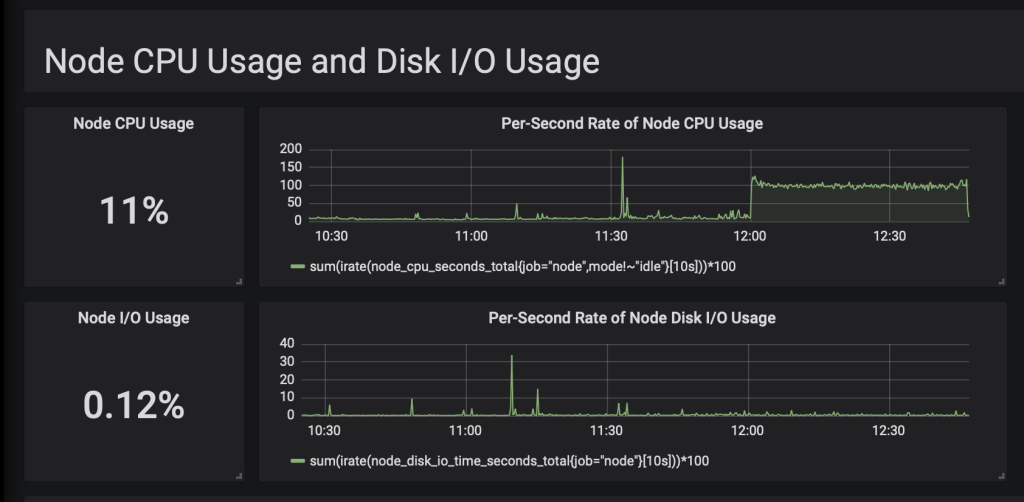
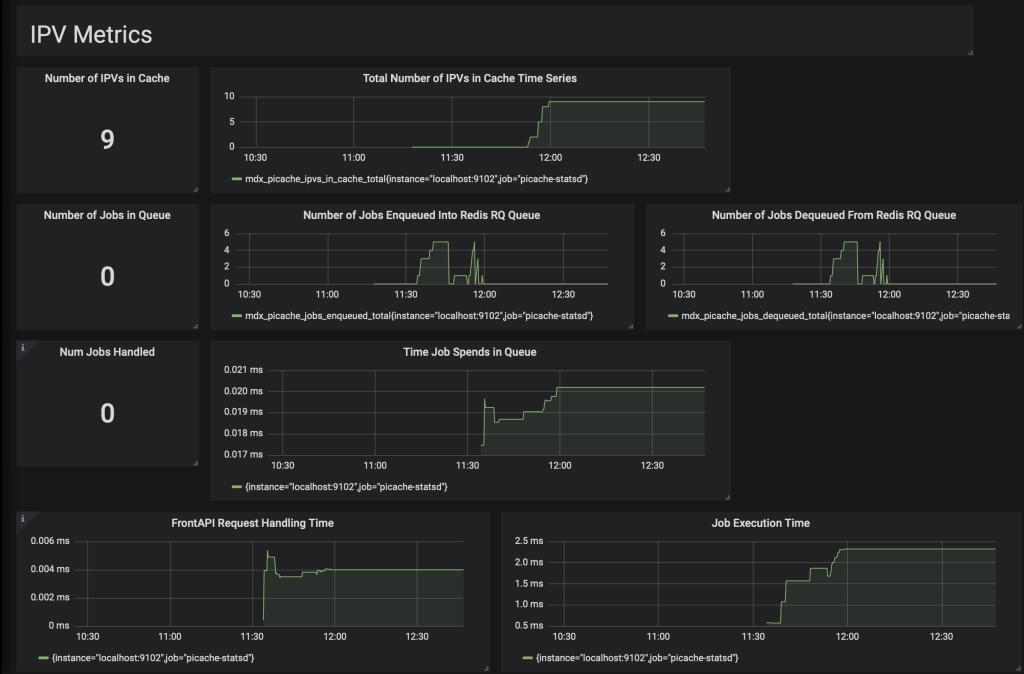
IPLM Cachedashboard
Some screenshots demonstrating the IPLM Cache dashboard:
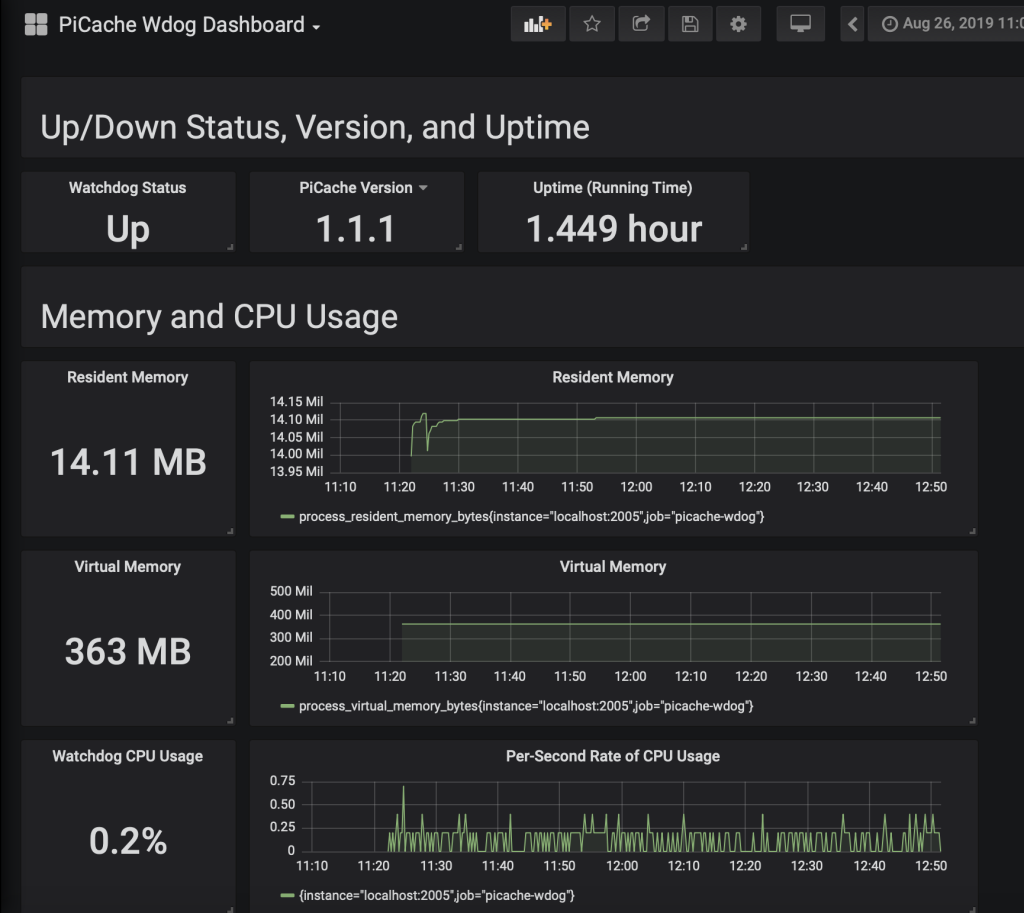
IPLM CacheWatchdog Monitor dashboard
Some screenshots demonstrating the IPLM Cache Watchdog Monitor dashboard :
Perforce IPLM Virtual Appliance
The Perforce IPLM Virtual Appliance comes preinstalled with the metrics monitoring solution. After running setup_metrics.sh, you only need to open a web browser, connect to the appliance's Grafana server (user admin, password admin), and switch to the dashboards of interest. See Perforce Appliance Installation.
Setting up monitoring with packages
Perforce packages required
Using yum, zypper, or apt-get, as appropriate, to install these packages, metrics requires:
- mdx-metrics for the Prometheus Server, Grafana Server, JMX Exporter, Node Exporter, and StatsD Exporter
- mdx-metrics >= 1.1.1 for the Grafana dashboard files and setup tool (previously in mdx-piextras)
- mdx-piserver >= 2.33.0 for PiServer & Neo4j extension metrics and piserver & neo4j run with the JMX Java Agent
- mdx-picache >= 1.2.0 for IPLM Cache & IPLM Cache Watchdog Monitor metrics
- mdx-picache-lib >= 1.1.0 for the Prometheus StatsD Library, used by IPLM Cache, and the Prometheus Python Client Library, used by the IPLM Cache Watchdog Monitor
For customers using Run packages from our self-extracting archives:
- mdx-piserver Run package >= 2.33.0 for the Prometheus Server, Grafana Server, and JMX Exporter; PiServer & Neo4j extension metrics; and piserver & neo4j run with the JMX Java Agent
- mdx-picache Run package >= 1.2.0 for the Prometheus Server, Grafana Server, Node Exporter, and StatsD Exporter; Prometheus Client Library and StatsD Library; IPLM Cache & IPLM Cache Watchdog Monitor metrics
Configuration file modifications
After installing the packages, the following configuration files need to be modified (done by the setup_metrics.sh script or can be done manually):
-
/usr/share/mdx/neo4j/current/conf/neo4j.conf
For the Neo4j Enterprise Edition, add the following to neo4j.conf:# Enable the Prometheus endpoint. Default is 'false'. metrics.prometheus.enabled=true # The IP and port the endpoint will bind to in the format <hostname or IP address>:<port number>. # The default is localhost:2004. #metrics.prometheus.endpoint=localhost:2004
-
/etc/mdx/piserver.yml
In theprometheussection, uncomment theenabledline to set it to true:# --------------------------------------------------
# Prometheus metrics
# --------------------------------------------------prometheus:
# Whether or not to enable the Prometheus exporter server
enabled: true
# Port of the Prometheus exporter server
port: 2002 -
/etc/mdx/picache.conf
In the [main] section, uncomment theprometheus-metrics-enable = Trueline and, if needed, the statsd-metrics-port line with a different port:# Indicate if IPLM Cache is to expose its metrics to Prometheus (True) # or not (False). Default = False. prometheus-metrics-enable = True # The port IPLM Cache uses to send StatsD metrics to if # prometheus-metrics-enable is True. Defaults to 9125. The Prometheus # statsd_exporter is used to send metrics to and is scraped by the Prometheus # server to get these metrics. #statsd-metrics-port = 9125
In the [watchdog] section, also uncomment the
prometheus-metrics-enable = Trueline and, if needed, the prometheus-metrics-port line with a different port:# Indicate if the Watchdog Monitor is to expose its metrics to Prometheus (True) # or not (False). Default = False. prometheus-metrics-enable = True # Give the port to expose Prometheus metrics on if prometheus-metrics-enable is # True. Defaults to 2005. #prometheus-metrics-port = 2005
Starting the services
Start the metrics service(s). Do this before starting the IPLM Server or IPLM Cache services in order to ensure Prometheus obtains configuration information from the piserver and picache services which are sent to Prometheus on piserver and picache startup.
On RHEL, CentOS, and SLES, a single service named mdx-metrics controls the starting, stopping, and restarting of the Prometheus and Grafana servers and the Node and StatsD exporters. For example:
On Debian, the mdx-metrics package deploys four services, mdx-metrics-prometheus for the Prometheus server, mdx-metrics-grafana for the Grafana server, mdx-metrics-node-exporter for the Node exporter, and mdx-metrics-statsd-exporter for the StatsD exporter:
# service mdx-metrics-prometheus start
# service mdx-metrics-prometheus status
● mdx-metrics-prometheus.service - MDX Metrics Prometheus Server
   Loaded: loaded (/etc/systemd/system/mdx-metrics-prometheus.service; enabled)
   Active: active (running) since Wed 2019-08-07 14:30:27 PDT; 4s ago
  ...
# journalctl -leu mdx-metrics-prometheus
...
Aug 07 14:30:27 debian8-ipcache1 systemd[1]: Started MDX Metrics Prometheus Server.
Aug 07 14:30:27 debian8-ipcache1 prometheus[20312]: level=info ts=2019-08-07T21:30:27.9
Aug 07 14:30:27 debian8-ipcache1 prometheus[20312]: level=info ts=2019-08-07T21:30:27.9
...

# service mdx-metrics-grafana start
# service mdx-metrics-grafana status
...
● mdx-metrics-grafana.service - MDX Metrics Grafana server
   Loaded: loaded (/etc/systemd/system/mdx-metrics-grafana.service; enabled)
   Active: active (running) since Wed 2019-08-07 14:32:46 PDT; 1min 16s ago
  ...

# service mdx-metrics-node-exporter start
# service mdx-metrics-statsd-exporter start
# service mdx-metrics-prometheus stop
# service mdx-metrics-grafana stop
# service mdx-metrics-node-exporter stop
# service mdx-metrics-statsd-exporter stop
The PiServer and Neo4j services can be started as normal, for example:
# service piserver start
The IPLM Cache service can be started as normal, for example:
# service picache start
Using the Self-Extracting archives
mdx-piserver
The mdx-piserver self-extracting archive, version 2.33.0 and higher, has the metrics components already installed.
After executing the .run package and cd'ing into the resulting directory, the package's conf/piserver.yml file will need to be modified per above to uncomment the metrics.enable line. The package's neo4j.conf file can also be modified as per above.
The Prometheus and Grafana servers are started by executing
$ bin/mdx-metrics.sh start
The PiServer and Neo 4j servers are started by executing
$ bin/piserverd --site-dir . --property conf/piserver.yml
mdx-picache
The mdx-picache self-extracting archive, version 1.2.0 and higher, has the metrics components already installed.
After executing the .run package and cd'ing into the resulting directory, the package's conf/picache.conf file will need to be modified per above to uncomment the prometheus-metrics-enable lines in the [main] and [watchdog] sections.
The Prometheus and Grafana servers and the Node and StatsD Exporters are started by executing
$ bin/mdx-metrics.sh start
The IPLM Cache supporting servers and IPLM Cache daemons are started by executing
$ bin/picache-backend-redis.sh start
$ bin/picache-backend-mongodb.sh start
$ bin/picache.sh start
If configured for a High-Availability configuration, the IPLM Cache Watchdog Monitor can be started by executing
$ local/bin/python -m methodics.wdog.mdx_wdog -c conf/picache.conf &
Using Both mdx-piserver and mdx-picache
It is possible to use both mdx-piserver and mdx-picache self-extracting archives as follows:
- Start the mdx-metrics services first from the mdx-picache self-extracting archive. This will start the Prometheus and Grafana servers and the Node and StatsD Exporters.
- Edit picache.conf and start the IPLM Cache components, as per above
- In the mdx-piserver self-extracting archive, edit the
conf/piserver.ymlfile and the neo4j.conf file, if desired, and start the piserver service
The Prometheus configuration file in the mdx-picache self-extracting archive, conf/mdx-metrics-prometheus.yml, contains targets for PiServer, Neo4j, their JMX Exporters, the Node Exporter, and IPLM Cache and the IPLM Cache Watchdog Monitor. The Prometheus configuration file in the mdx-piserver self-extracting archive, mdx-prometheus-bin-2.9.2/mdx-metrics-prometheus.yml, is identical, though the mdx-piserver Run package does not contain the Node and StatsD Exporters.
Port changes
Default out-of-the-box port configurations are:
|
Component
|
Port
|
Configured in
|
|---|---|---|
| IPLM Server port for scraping by Prometheus | 2002 |
mdx-piserver RHEL, CentOS, SLES, Debian: mdx-piserver Run Self-Extracting Archive:
Also referenced in:
|
| IPLM Server JMX Exporter port for scraping by Prometheus | 2003 |
mdx-piserver RHEL, CentOS, SLES, Debian:
mdx-piserver Run Self-Extracting Archive:
Also referenced in:
|
| Neo4j port for scraping by Prometheus | 2004 |
mdx-piserver RHEL, CentOS, SLES, Debian:
Also referenced in /etc/mdx/mdx-metrics-prometheus.yml in Only works with Neo4j Enterprise Edition. Also referenced in:
|
| Neo4j JMX Exporter port for scraping by Prometheus | 2001 |
mdx-piserver RHEL, CentOS, SLES: Debian: Also referenced in /etc/mdx/mdx-metrics-prometheus.yml in mdx-piserver Run Self-Extracting Archive: Also referenced in:
|
| IPLM Cache StatsD Exporter port for scraping by Prometheus | 9102 |
mdx-picache RHEL, CentOS, SLES:
Debian: Also referenced in /etc/mdx/mdx-metrics-prometheus.yml in mdx-picache Run Self-Extracting Archive: Also referenced in:
|
| IPLM Cache StatsD Exporter TCP and UDP ports for accepting metrics from IPLM Cache | 9125 |
mdx-picache RHEL, CentOS, SLES:
Debian: IPLM Cache Configuration [main] Section: mdx-picache Run Self-Extracting Archive: |
| IPLM CacheWatchdog Monitor port for scraping by Prometheus | 2005 |
mdx-picache IPLM Cache Configuration [watchdog] Section: Also referenced in /etc/mdx/mdx-metrics-prometheus.yml in job_name: picache-wdog section mdx-picache Run Self-Extracting Archive: Also referenced in:
|
| Node Exporter port for scraping by Prometheus | 9100 |
mdx-picache RHEL, CentOS, SLES:
Debian: Also referenced in /etc/mdx/mdx-metrics-prometheus.yml in mdx-picache Run Self-Extracting Archive: Also referenced in:
|
| Prometheus | 9090 |
RHEL, CentOS, SLES:
Debian: Also referenced in /etc/mdx/mdx-metrics-prometheus.yml in Run Self-Extracting Archives: bin/mdx-metrics.sh: Also referenced in:
|
| Grafana | 2000 |
RHEL, CentOS, SLES, Debian:
mdx-piserver Run Self-Extracting Archive: mdx-picache Run Self-Extracting Archive: |
If any port needs to be changed, the above table shows where the change(s) need to be made. After changing the port, the relevant service needs to be restarted, and if the port affects where Prometheus scrapes metrics from, then the mdx-metrics service (RHEL, CentOS, SLES) or the mdx-metrics-prometheus service (Debian) needs to be restarted.