Events example - Splunk integration
The Perforce IPLM Splunk events handler pulls data from the Perforce IPLM events platform. This data can be used to display informative and powerful dashboards within Splunk. Example dashboard data might include:
- IP creation by user, group, or project
- Project activity
- Consumption of IPs by Geo and Project
- Performance by command
Important: We recommend you contact IPLM Solutions to assist in completing the procedures listed in this section.
Overview
Splunk is a product that captures, indexes and correlates real-time data in a searchable repository, from which it can generate graphs, reports, alerts, dashboards and visualizations [wikpedia] .
Integration
Splunk can be used to analyze the actions from the events system. The integration works as follows:
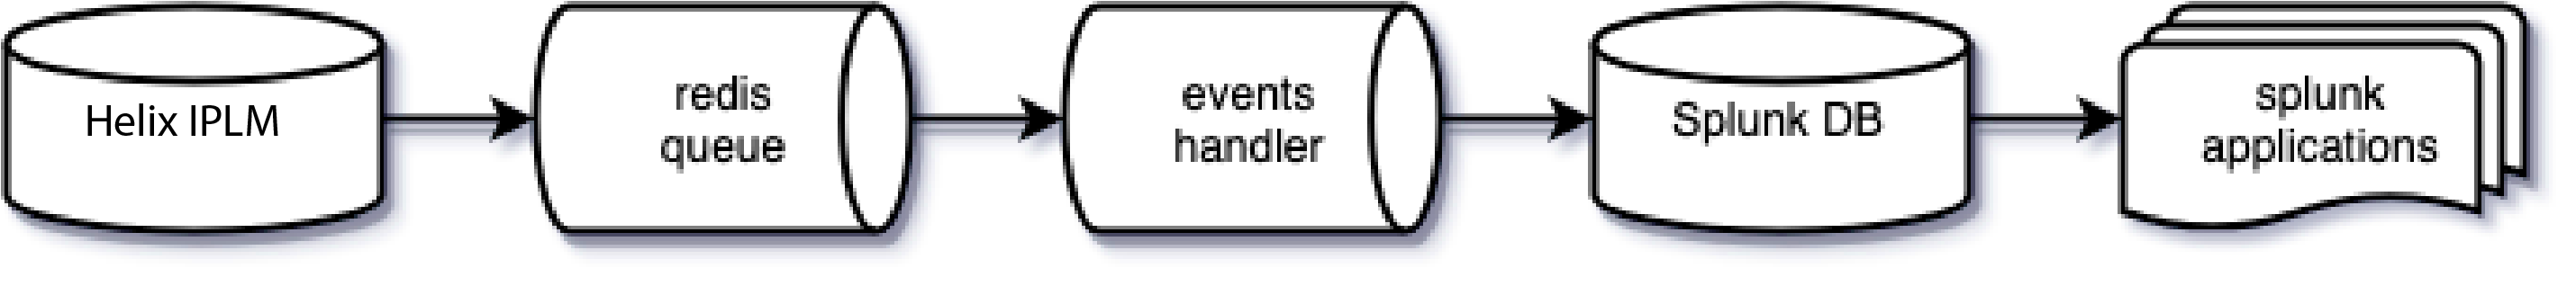
- Perforce IPLM has been configured through Events Administration to send Events into a redis pubsub queue
- Redis is a high performance message broker that can publish events to multiple subscribers
- The events handler is a python script provided inside mdx-piextras that will receive updates from the redis queue
- This handler can have one or more plugins to process the event data
- The provided Splunk plugin will extend the event data with additional information obtained via queries with the Perforce IPLM Public API
- And send this data to Splunk via the the HEC interface to receive and store data
- Spunk will store these events chronologically, and this data can be analyzed via searches
- Predefined reports and dashboards can be stored via Splunk Applications
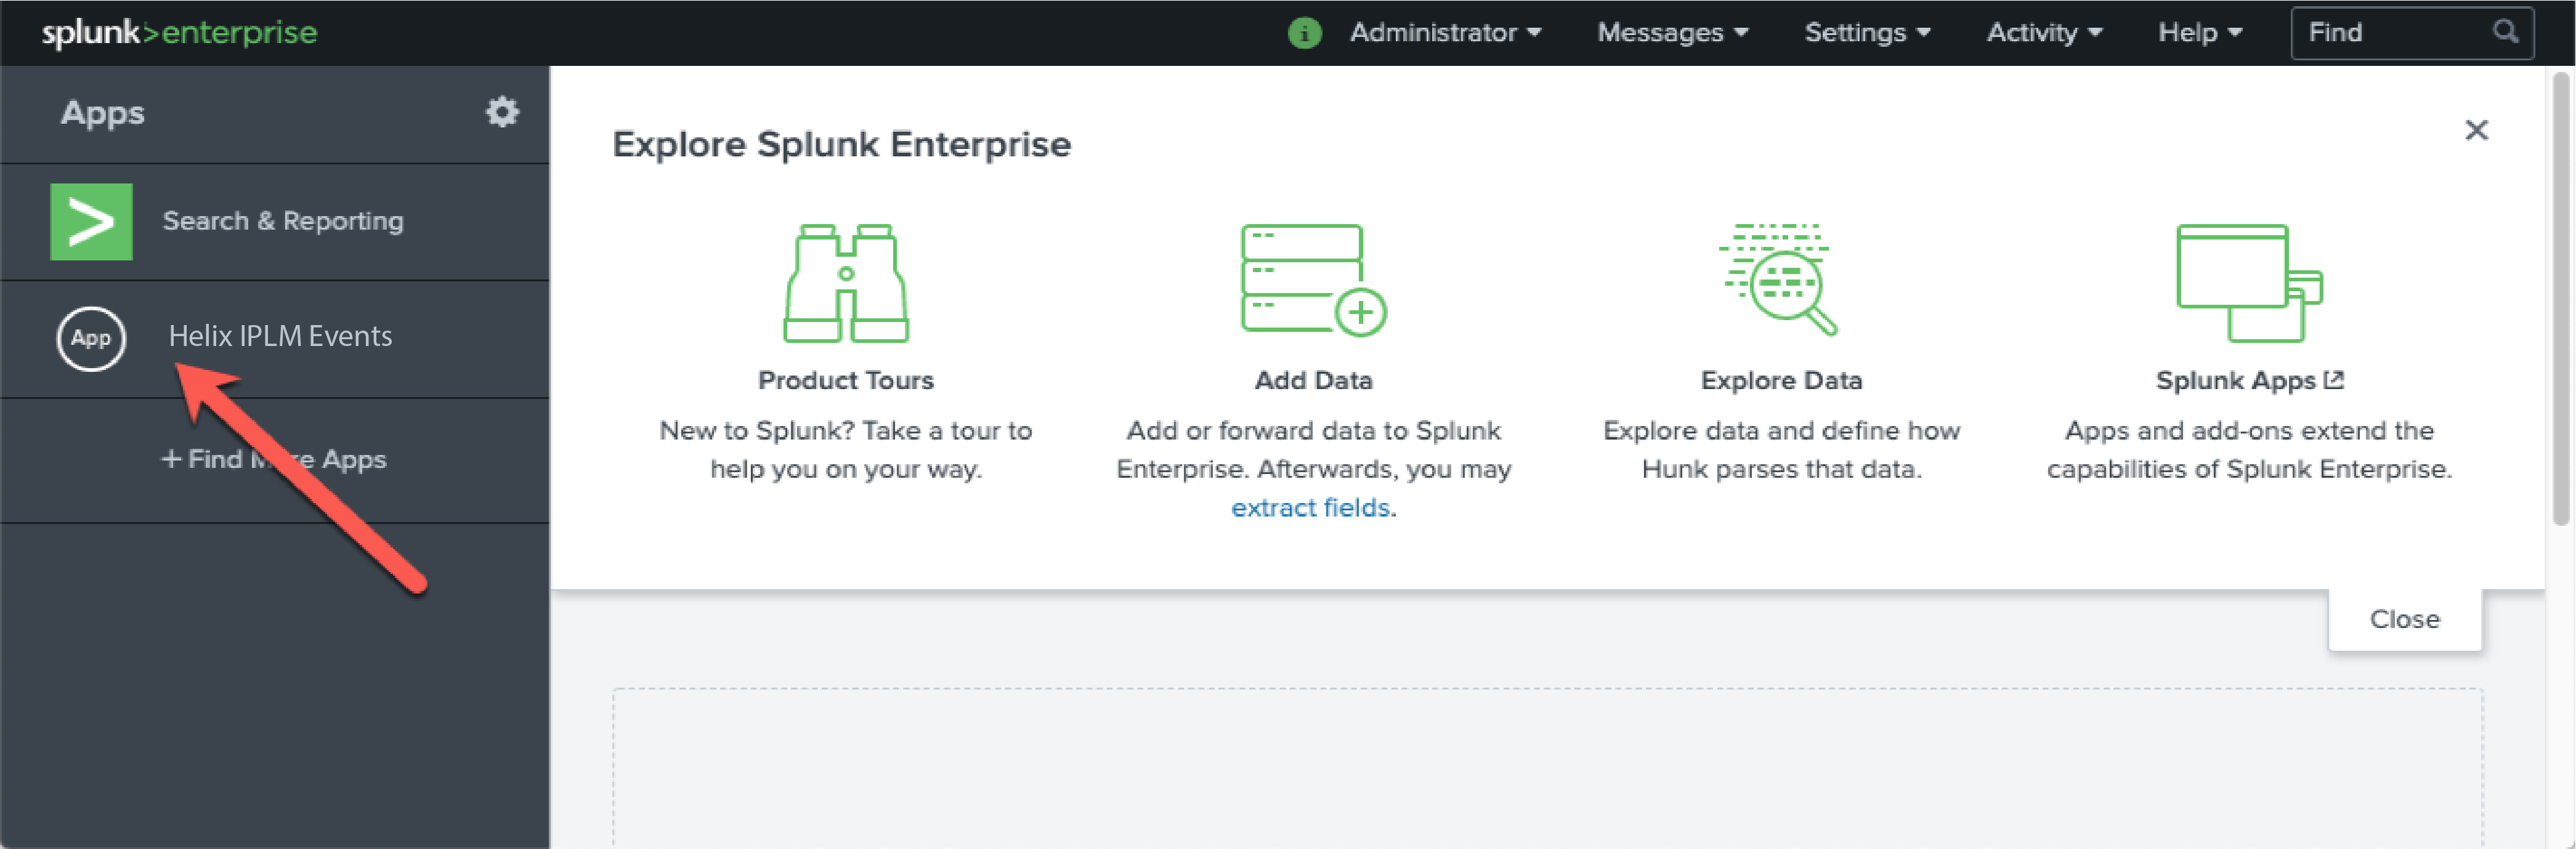
Application
Here is an example of a predefined Splunk application for Perforce IPLM Events:
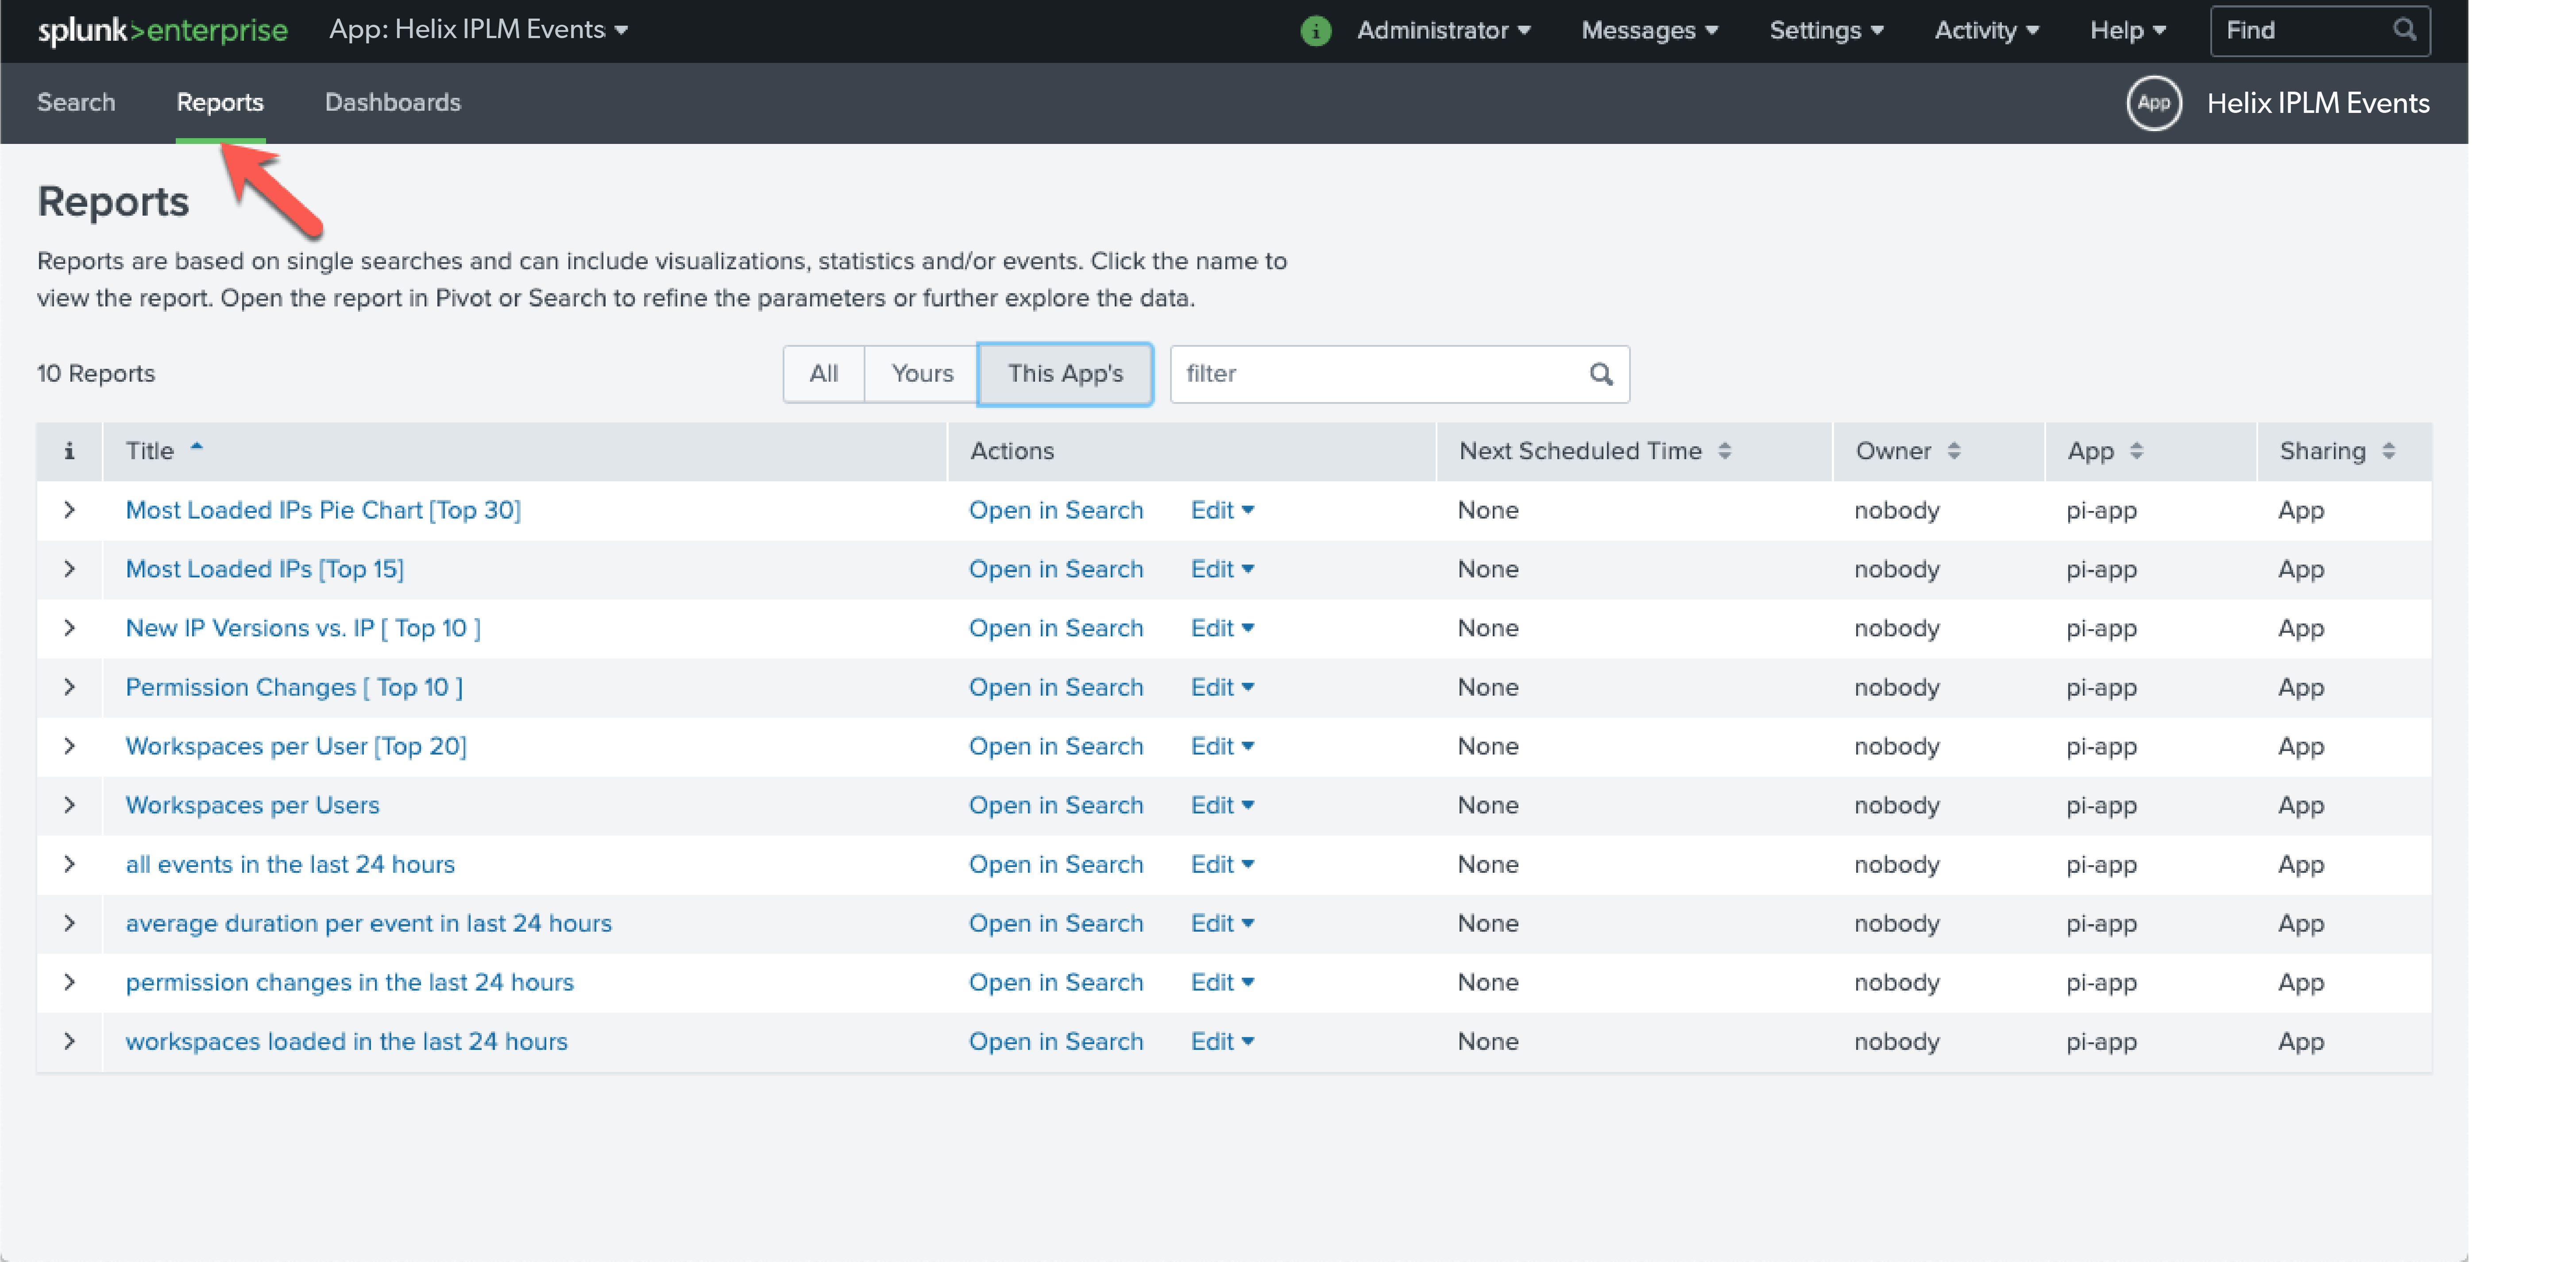
Within this application various Reports and Dashboards have been configured to report common actions:
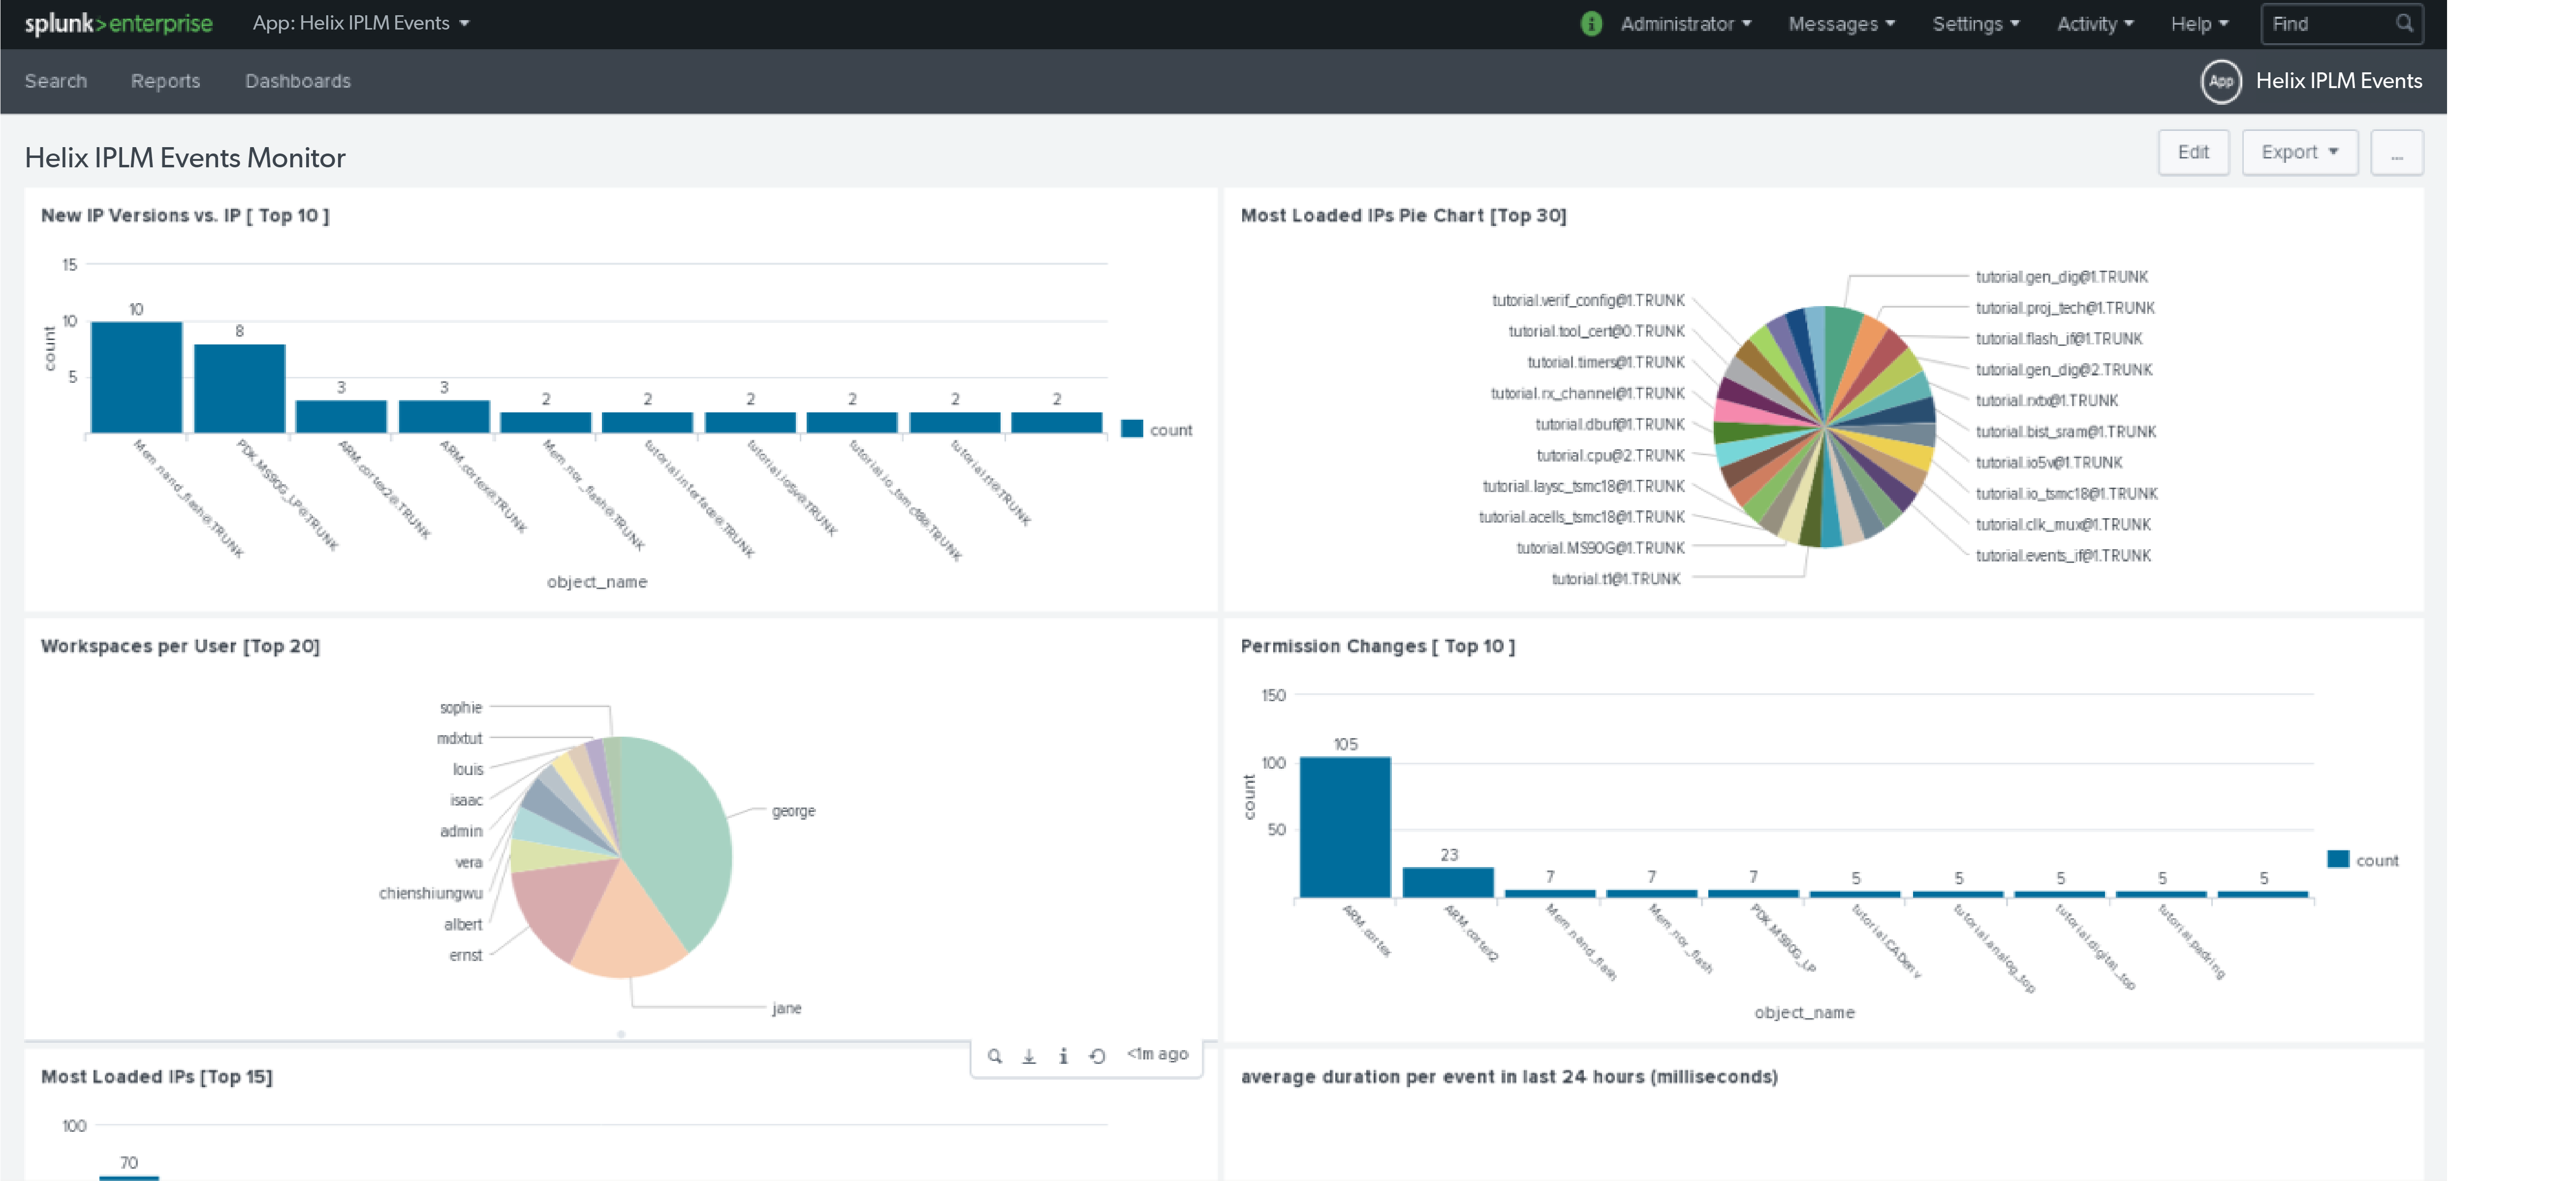
An example dashboard:
Examples
Splunk works via search queries, here are some example queries:
The most basic search would be to show all the events that are received via the HEC interface:
source="http:splunk_hec_token"
To get an idea of the average duration of an event:
source="http:splunk_hec_token" | timechart avg(duration_ms) by event_type
This query could be used to view the top 20 number of workspaces by user"
source="http:splunk_hec_token" event_type=pi_load_ip | spath output=resources path=ipv_resources{} | eval comb=mvappend(resources,ipv_name) | chart count by user_name | sort limit=20 - count
See the top 20 IPVs that have permission changes:
source="http:splunk_hec_token" event_type=pi_set_ip_perms | spath output=perms path=ip_perms{} | chart count over object_name | sort limit=20 - count
See new top 10 IP Versions vs IP:
source="http:splunk_hec_token" event_type=pi_add_ipv | chart count over object_name | sort limit=10 - count
See the top 15 most loaded IPs:
source="http:splunk_hec_token" event_type=pi_load_ip| spath output=resources path=ipv_resources{} | eval comb=mvappend(resources,ipv_name) | chart count by comb | sort limit=15 - count