How To: Using cumulative flow diagrams
The Cumulative Flow Diagram (CFD) is a useful diagram from queuing theory that looks something like this:
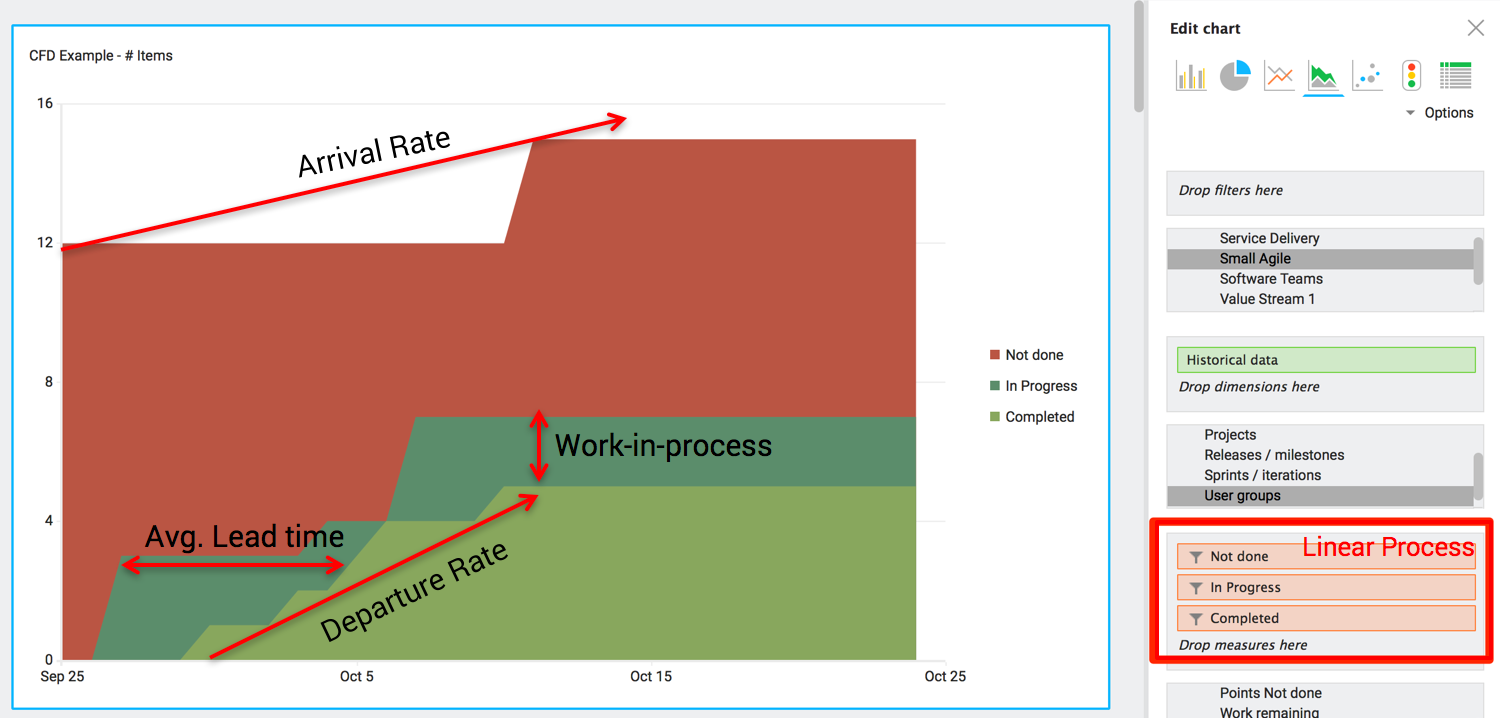
This chart will help you understand:
- The work in process (WIP) over time
- Arrival and departure rate of work
- The average lead time
This article covers how you can set this up using Hansoft, which may save time and help you gain new insights.
1. Create the reports
The prerequisite before you get started is that you can answer yes to this question: Can your way of working be explained as a linear process, with sequential steps? For example Select, Analyze, Code, Test, Ship.
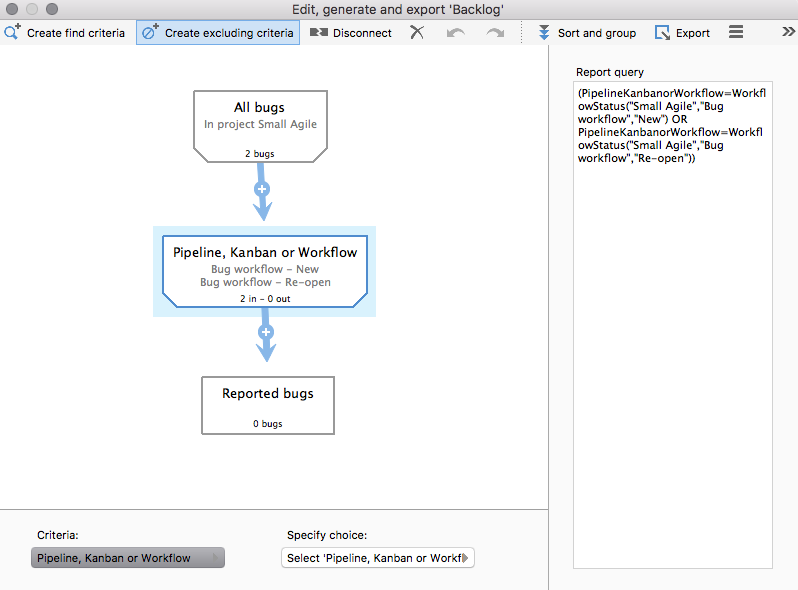
The first step is then to create reports, one report capturing all the items that are currently in each step.
If you are using a workflow, this report typically looks like this:
The CFD can cover multiple projects, but you must then ensure that these reports are created in the Portfolio find section.
2. Create the chart
The second step is to create a dashboard for your CFD. I recommend you put this on a separate page so that you can easily share it with your peers.
One question to think about here is: What is our unit of measure?
In most cases you can take the measure 'number of items'. Though items varies in size, over time they either tend to cluster around some average or can be divided into separate classes of services (such as separating features and bugs). But feel free to use estimated days, points or the measure you find most valuable.
The magic trick is to add this measure for each step in your pfarocess and filter on the report you created in step 1:

Add Historical data as the dimension.

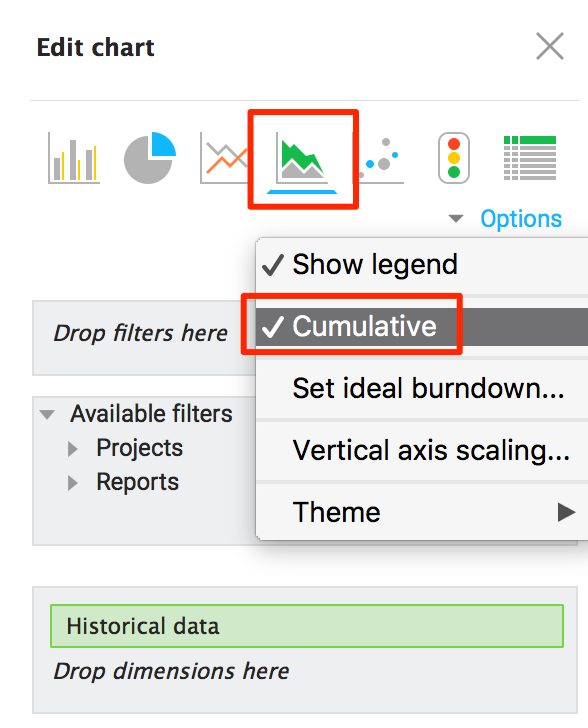
The next step is to select the right type of chart and select the option 'Cumulative' so that the values stack on each other:
3. Wait for data and then analyze continuously
As this chart uses Historical Data we must wait for Hansoft to snapshot the data each day. After a few days, revisit this chart and see if it seems to represent the reality as you see it. If not, ask yourself why - and make it a habit to revisit this chart once in a while.


