How To: Understanding Throughput
In this topic, we will walk you through the concepts around understanding throughput in Hansoft.
Most processes can be described in a linear form, in one of the simplest example an item in Hansoft moves from "Not Done" to "In Progress" to "Completed".
This figure illustrates a simple process with some key attributes:
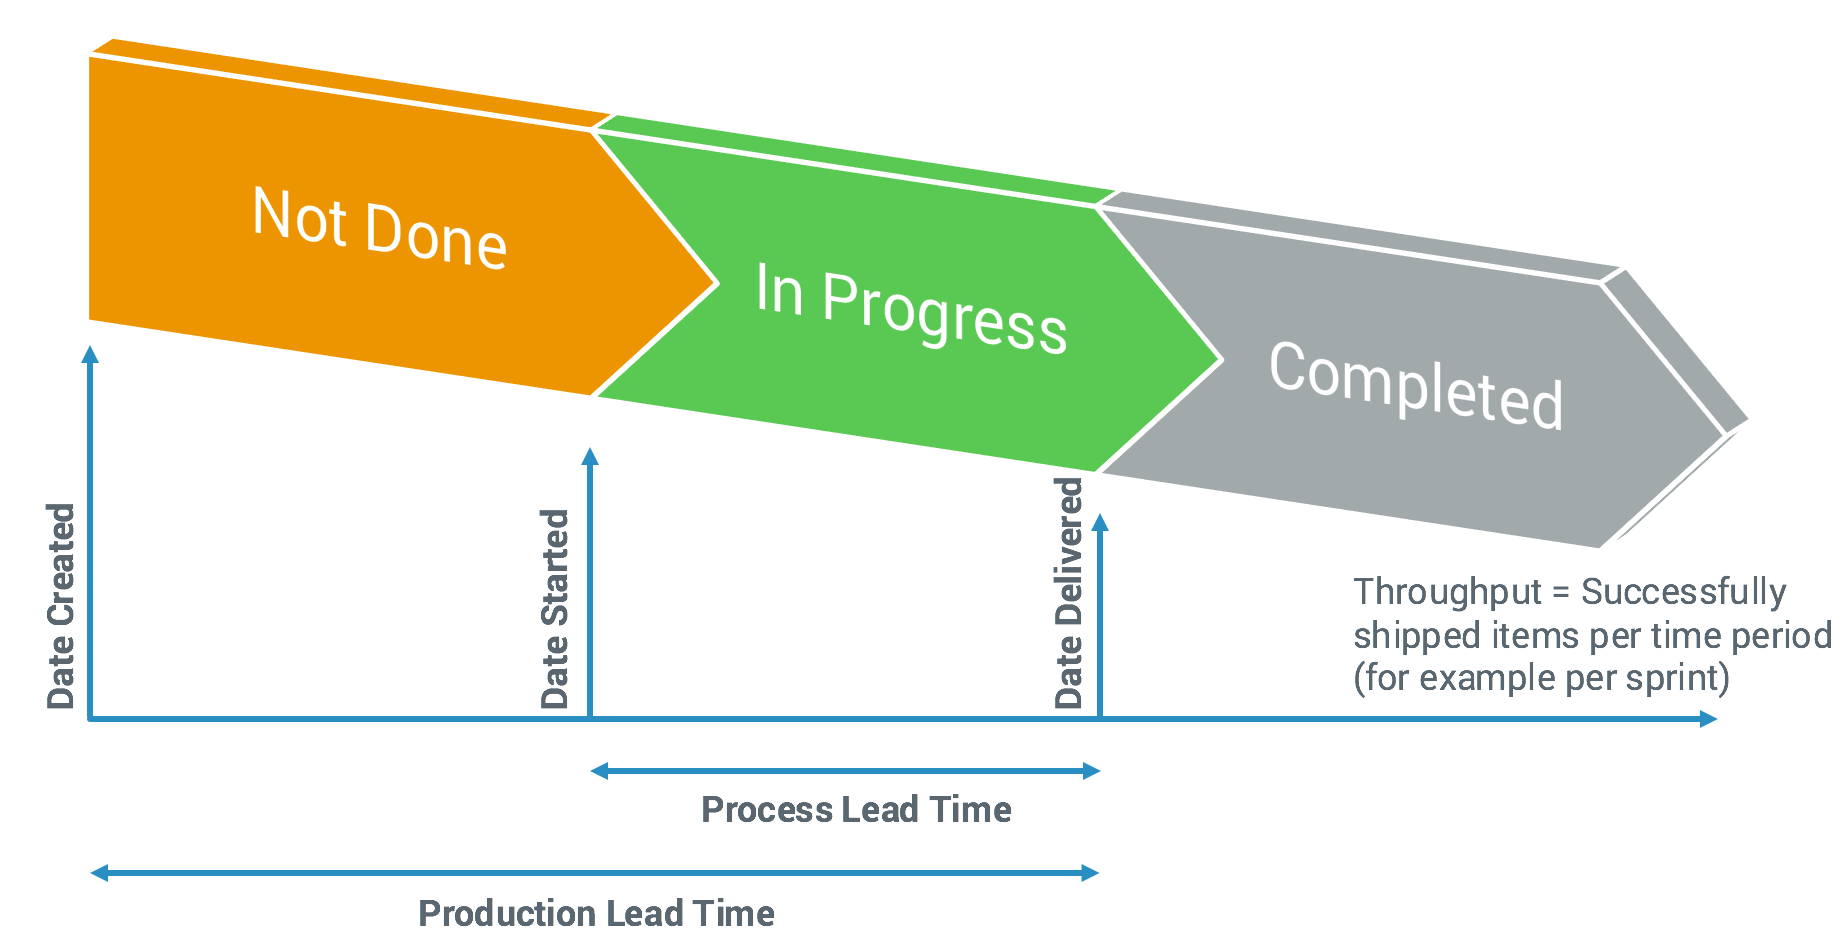
Throughput in this perspective is essentially the rate at which items can go through this process. In Scrum, we only value finished work so in this article we will use the event that something gets Completed as key to understand throughput.
As throughput will vary over time (there are things happening all the time, some of which you are in control of and some you are not). To get the time perspective we will walk through two examples here:
- Completed items per sprint (with fixed duration)
- Based on actual dates completed
Completed items per sprint
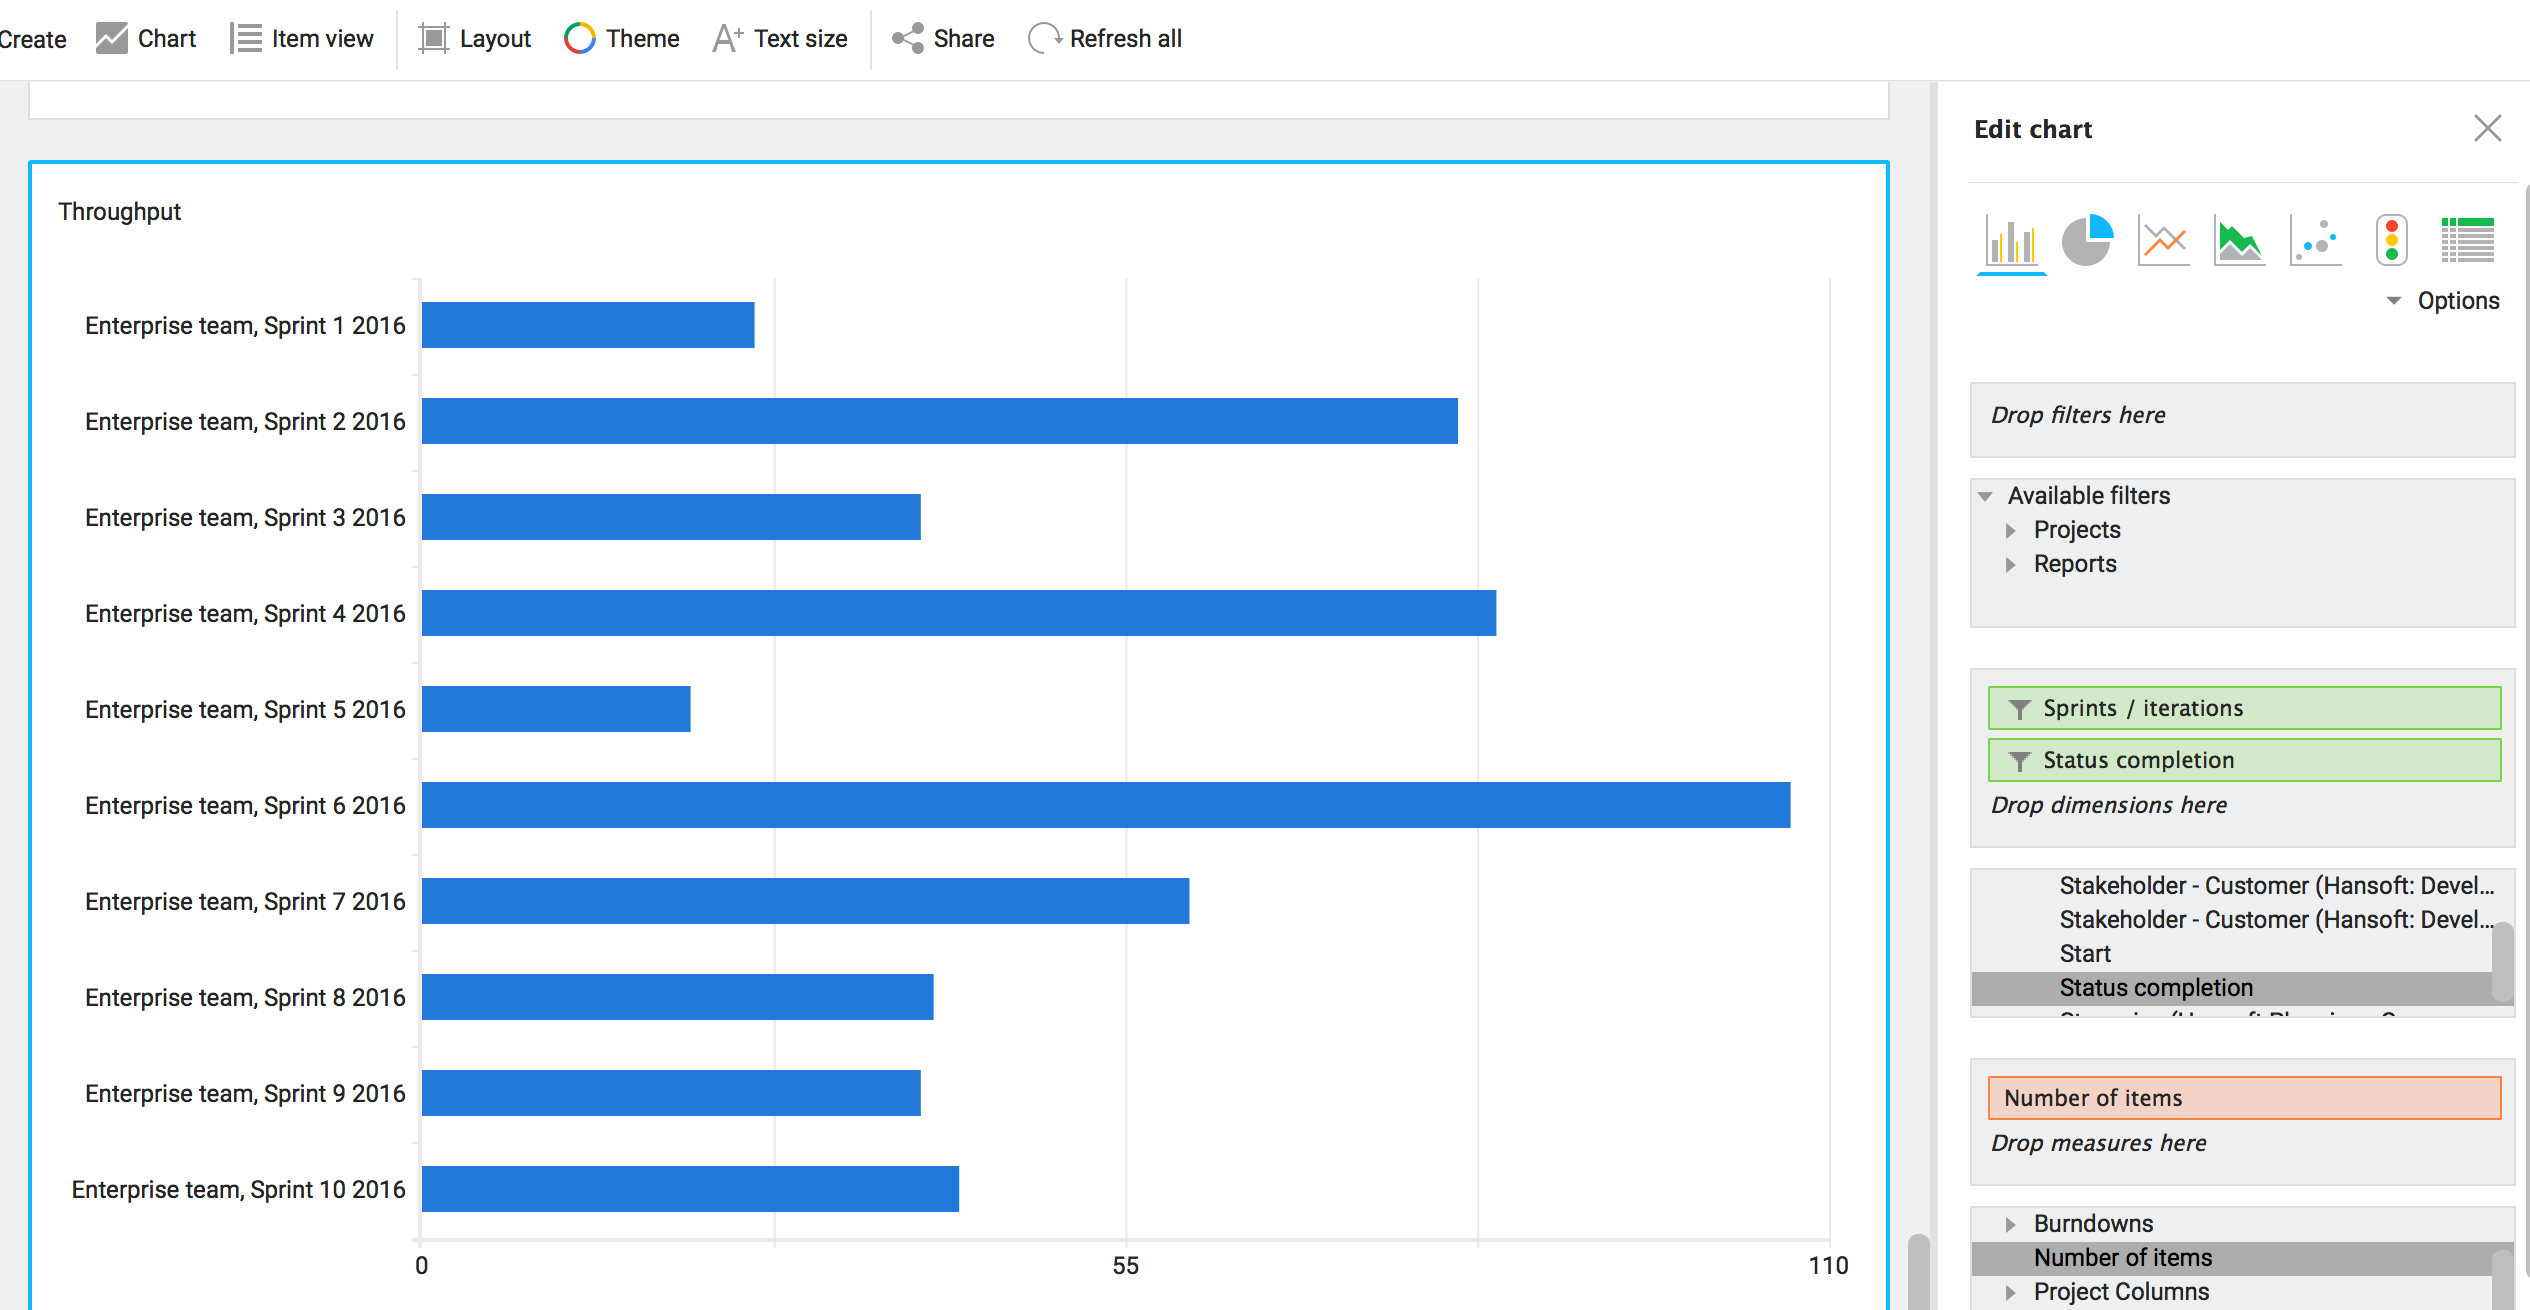
1. Go to Dashboards, find the page to show the throughput on (or create a new) and click on Create Chart.
2. Add Status Completion as the first Dimension. Click on the Status completion dimension and choose to Filter to only see Completed items.
3. Add Sprints/Iterations as the second dimension. Filter the sprints that you are interested in.
4. Add Number of Items or any other relevant estimate field as the measure.
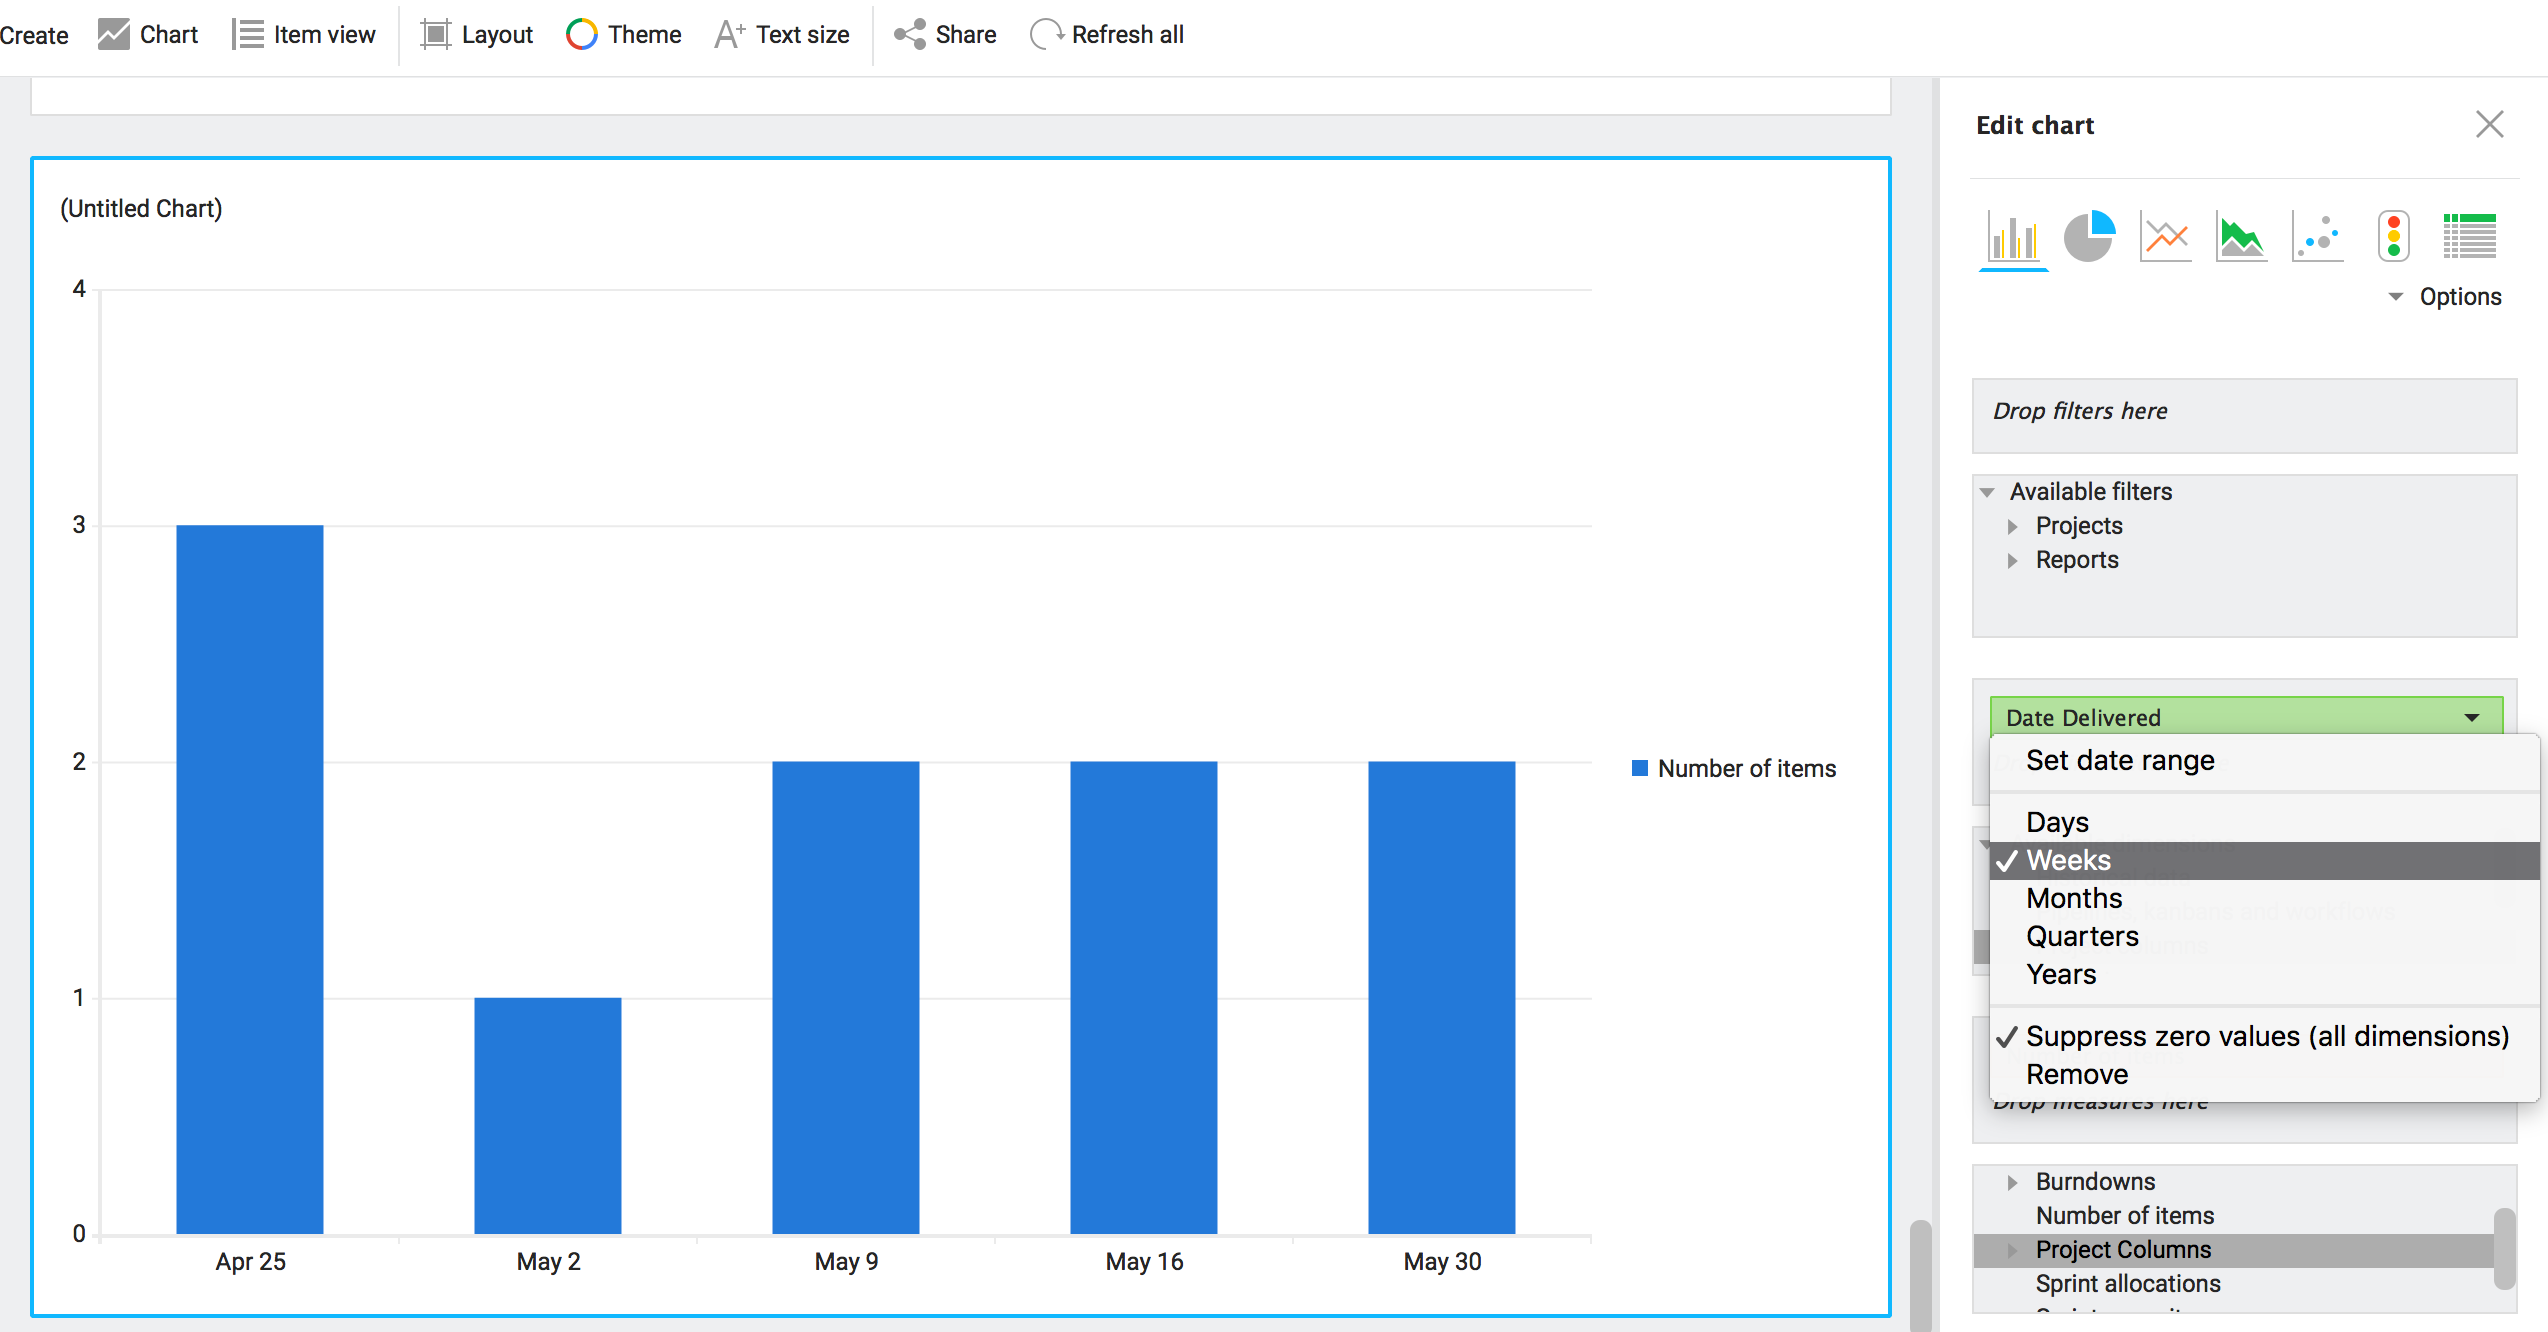
In the picture below the Options on the chart have been changed to:
- Clear Show legend
- Horizontal Bars
Actual Date Completed
Note: To follow some of the steps you must have Main Manager privileges.
1.In the Product Backlog, go to More > Customize Projects.
2. Click on Create Column
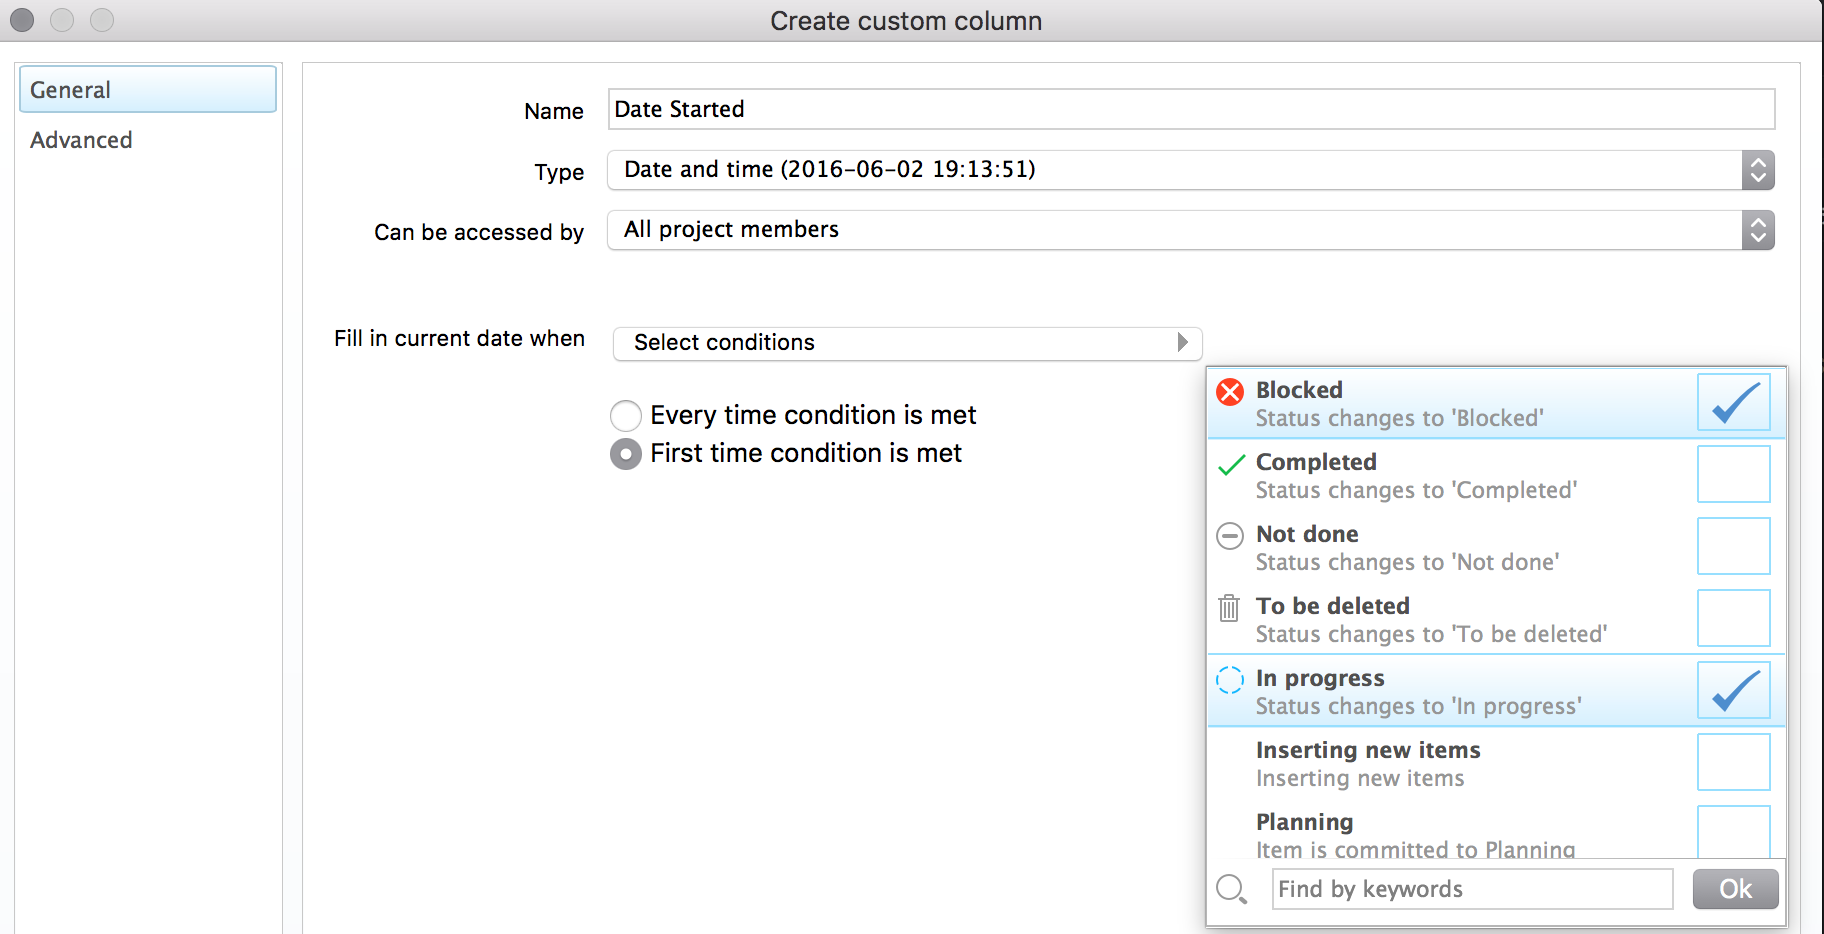
3. Change the type of the column to Date and Time
4. Name the column Date Started
5. Consider how you prefer the option Can be accessed by to be set.
6. Under Fill in current date when select In Progress and Blocked and make sure to select that it should only be filled in the First time condition is met.
7. Click OK
Now do the same thing again with these differences:
- Name the column Date Delivered
- Select the status Completed instead
- Select that it should be updated Every time condition is met (in case something goes to rework).
The final thing you want to make sure is that the column Originally Created On is activated.
You will now have 3 columns that will be set when you update the status of this item:
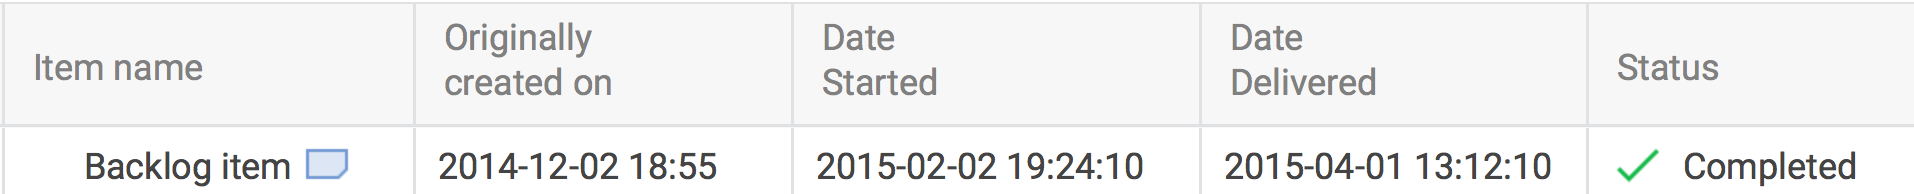
It is then possible to create a chart using Date Delivered and Number of items (or other relevant estimate column) as measure to understand throughput over time: