Adding dashboard burn down widgets
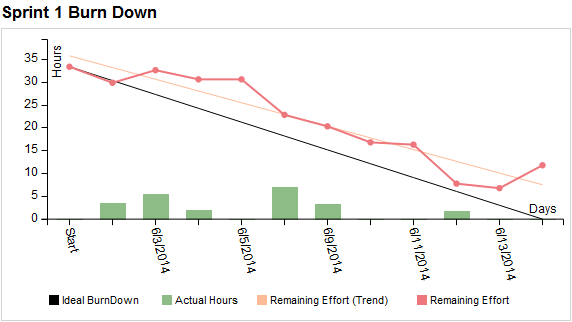
Burn down charts are commonly used in Agile to show work left to do versus time available for a sprint, iteration, release, or project phase. Use burn down widgets on dashboards to monitor progress during a specified planning period and quickly see if the remaining work will complete on time.
Note: Time tracking must be used in the project to provide data for burn down widgets. See Configuring time tracking.
1. Choose Tools > Administration > Dashboards or Dashboard Widgets. The available option depends on your security permissions.
If you can configure dashboards and widgets, the Configure Dashboards dialog box opens. Click Configure Widgets.
If you can only configure widgets, the Configure Widgets dialog box opens.
2. Click Add and select Burn Down.
You can add a maximum of 100 chart widgets, which also includes burn up and other chart widgets.
3. Specify the basic widget information.
- Name identifies the widget on the dashboard. You can enter up to 128 characters.
- Description provides additional information about data the widget displays and is shown in a tooltip when users mouse over it. If you create multiple widgets with the same name, use the description to distinguish them. You can enter up to 255 characters.
- Security groups are the groups that can view the widget. You can select a specific group, multiple groups, or <All> to let all groups view the widget.
4. Select a Time tracking fields option to show the planned and completed work.
- Hours are the number of working hours in the time period specified in the planning information.
- Story points are a relative unit of measurement typically used in Agile to estimate the difficulty or complexity of work items. In the widget, story points are deducted as items with story points move to a closed workflow state.
Note: Users must have access to view the time tracking fields to see burn down data. To see data in hours, the selected security group must have read/write or read only access for the Actual Hours, Estimated Hours, and Remaining Hours fields. To see data in story points, the selected security group must have read/write or read only access to the Story Points field. See Managing security groups.
5. Select a Units option to show the time available to complete the work. You can use days, weeks, or months relative to the specified planning period.
6. Select Filter items to only include the selected item types in the chart.
Optionally select a filter for each selected item type to only include filtered items in the chart or select Add filter to create a new filter. See Adding filters. Interactive filters and filters with <current user> restrictions are not available for widgets.
7. Optionally select a Folder that contains the items to include. Click Browse to select the folder.
- Select Recursive to include any child folders and then select the child folder types to include.
- Click Clear to clear the folder path if you do not want to use a folder.
8. Specify the Planning information for the time period to use for calculating the time available to work on a release, iteration, or project phase. If you selected a folder with release planning enabled, you can choose to use the release planning information configured for it.
- Enter a Start date and End date.
- Select Include weekends to include Saturday and Sunday in the total number of working days for the specified period.
9. Click OK to save the widget.
After saving the widget, add it to a dashboard so users can see it. See Configuring dashboards.


